
Measuring Temperature Humidity and Atmospheric Pressure#
What is Celsius?#
Celsius is a way to measure temperature. It’s named after a scientist named Anders Celsius. In Celsius, water freezes at 0 degrees and boils at 100 degrees. So, if it’s 20 degrees Celsius outside, it’s not too cold or too hot—it’s just right for many people. Scientists use Celsius because it’s easy to understand and it’s based on how water behaves at different temperatures. In the United States, we use Fahrenheit for temperature. Compare and contrast the differences between Celsius and Fahrenheit in the image below.

What is Humidity?#
Humidity is a measure of how much moisture or water vapor is in the air around us. It’s what makes the air feel sticky or dry. When humidity is high, like on a humid day, it means there’s a lot of moisture in the air. When humidity is low, the air feels drier. Humidity is important for weather and how comfortable we feel. It can affect things like how quickly sweat evaporates from our skin, which helps cool us down.
What is Atmospheric Pressure?#
Atmospheric pressure is the weight of the air pushing down on us and everything around us. It’s like the pressure you feel when you dive deep underwater. This pressure comes from the huge blanket of air, called the atmosphere, that surrounds the Earth. Atmospheric pressure changes with the weather and altitude. It’s important for predicting weather patterns because high pressure usually means clear skies, while low pressure often brings clouds and rain.

Measuring Temperature Humidity and Atmospheric Pressure with the micro:bit and the Kitronik Air Quality and Environmental Board#
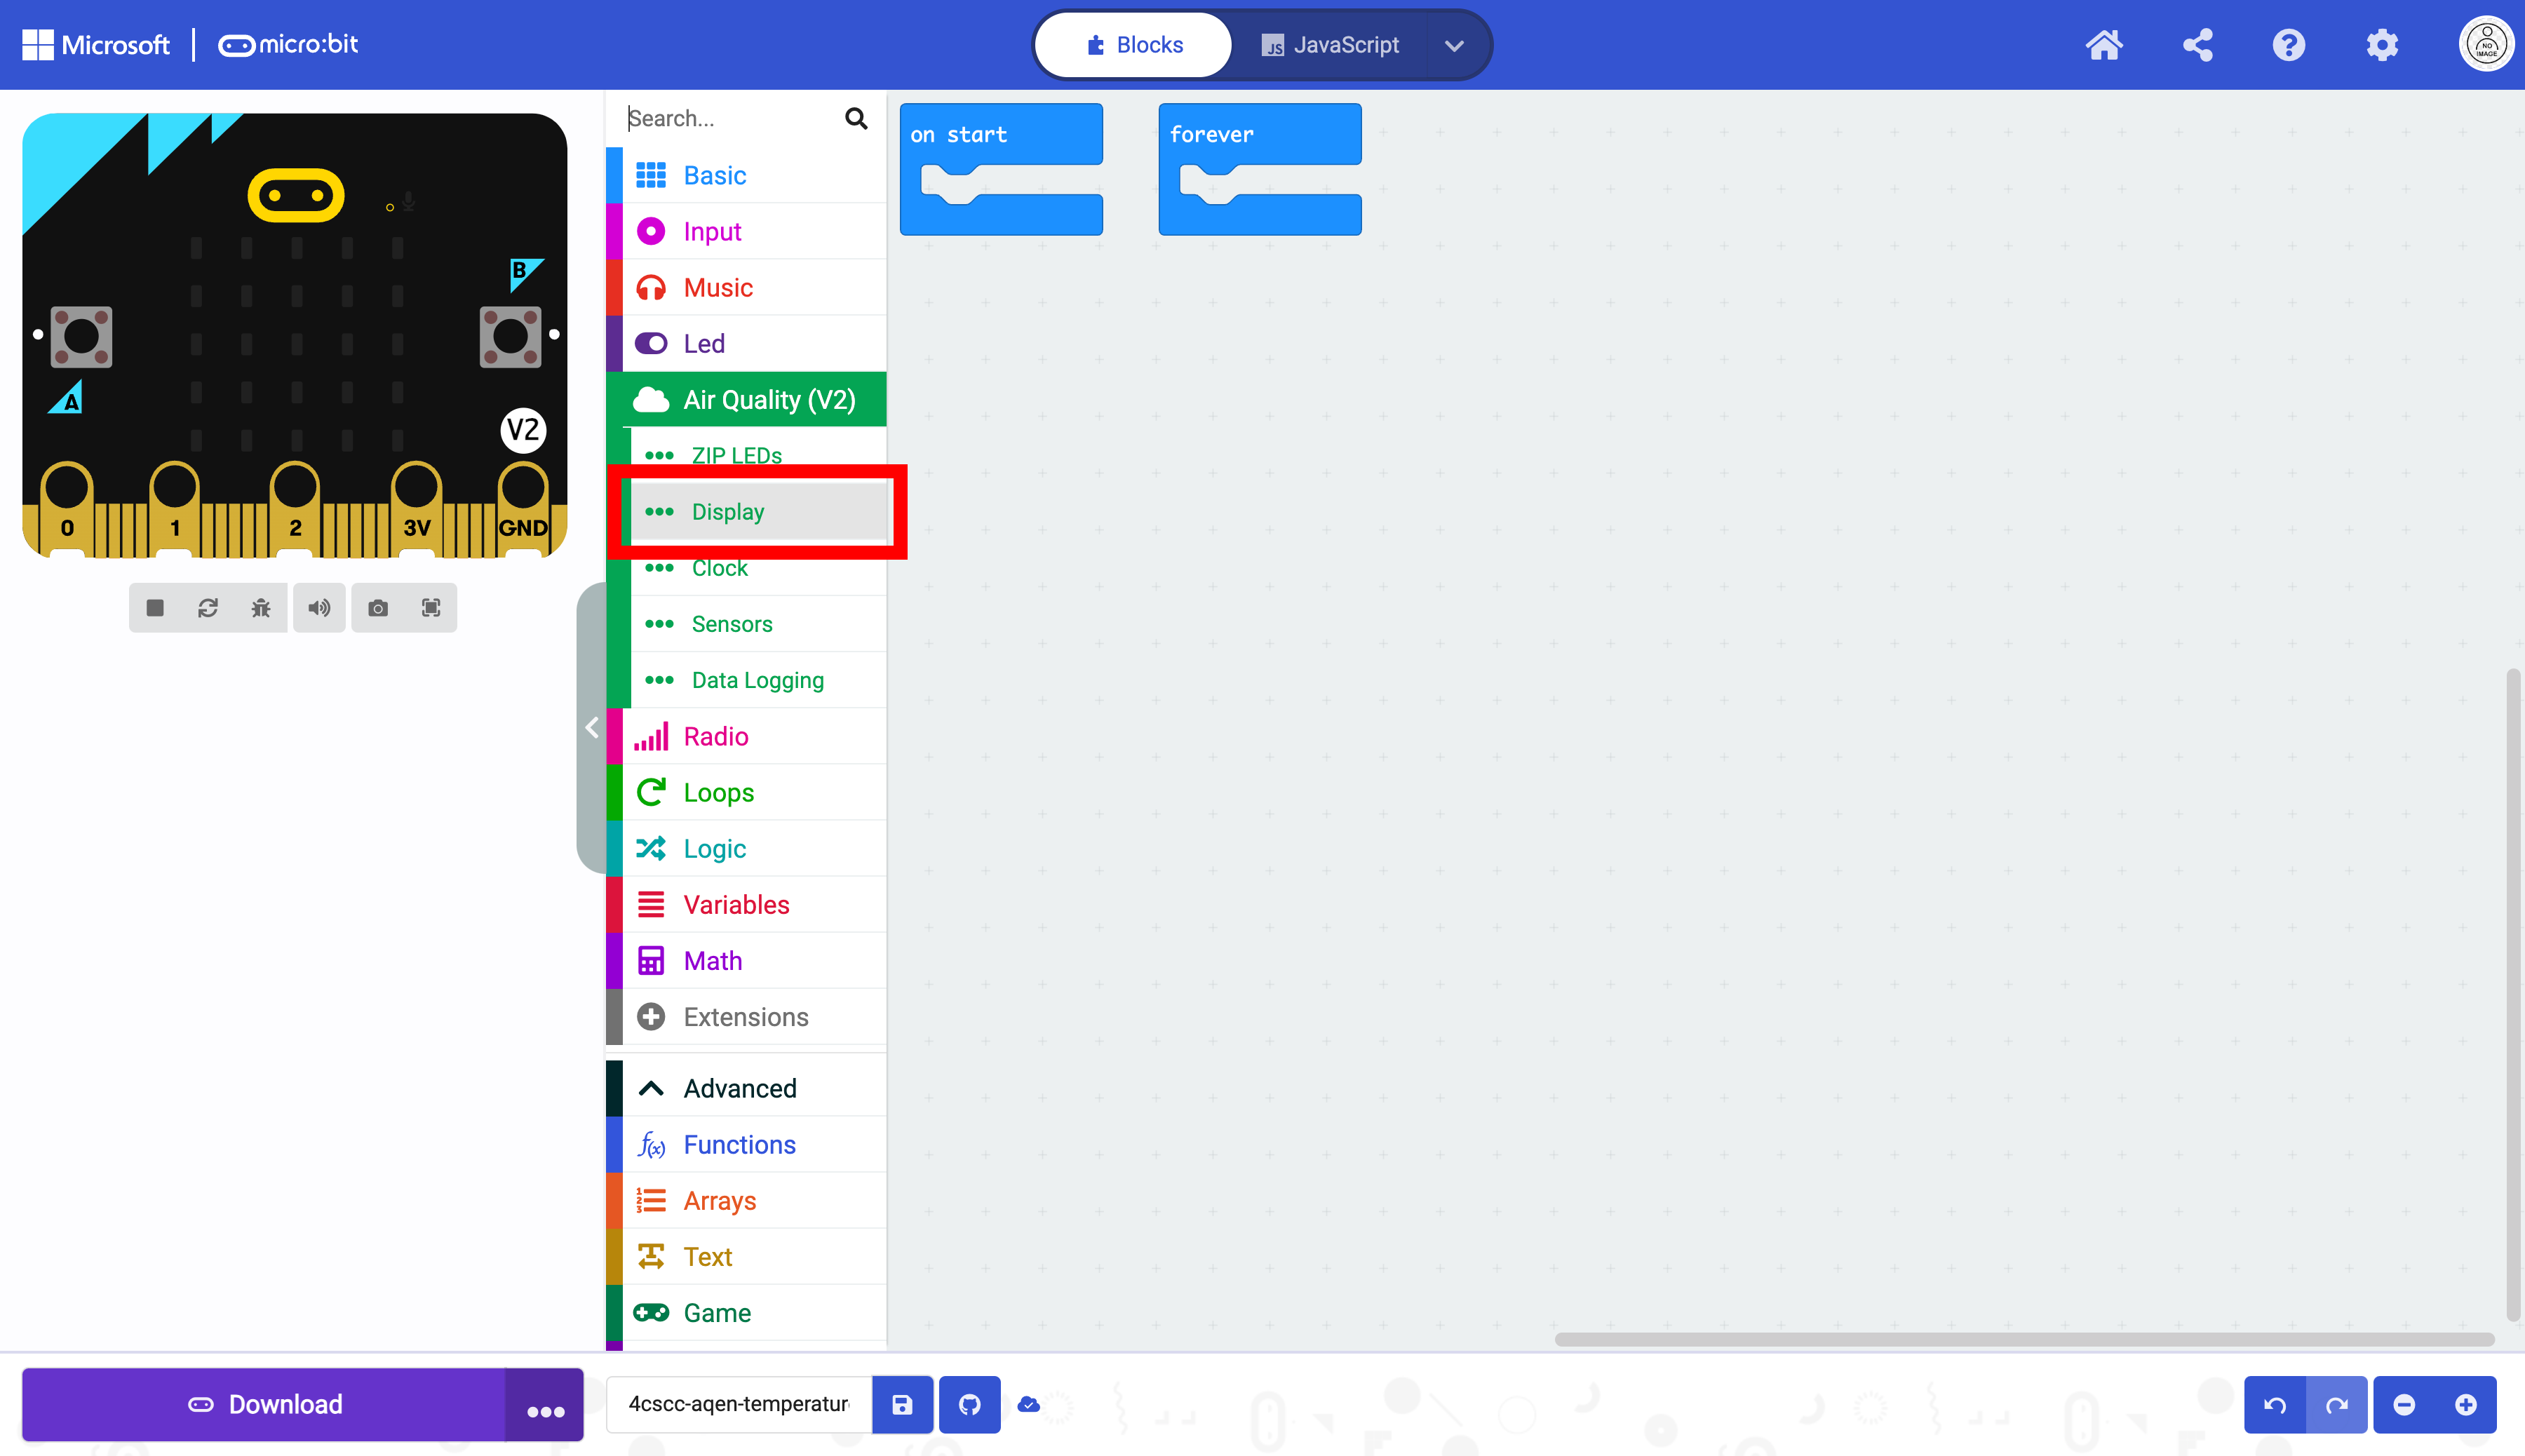
As in the previous lesson we have to initialize the display. Select the “Display” drawer in the Toolbox.
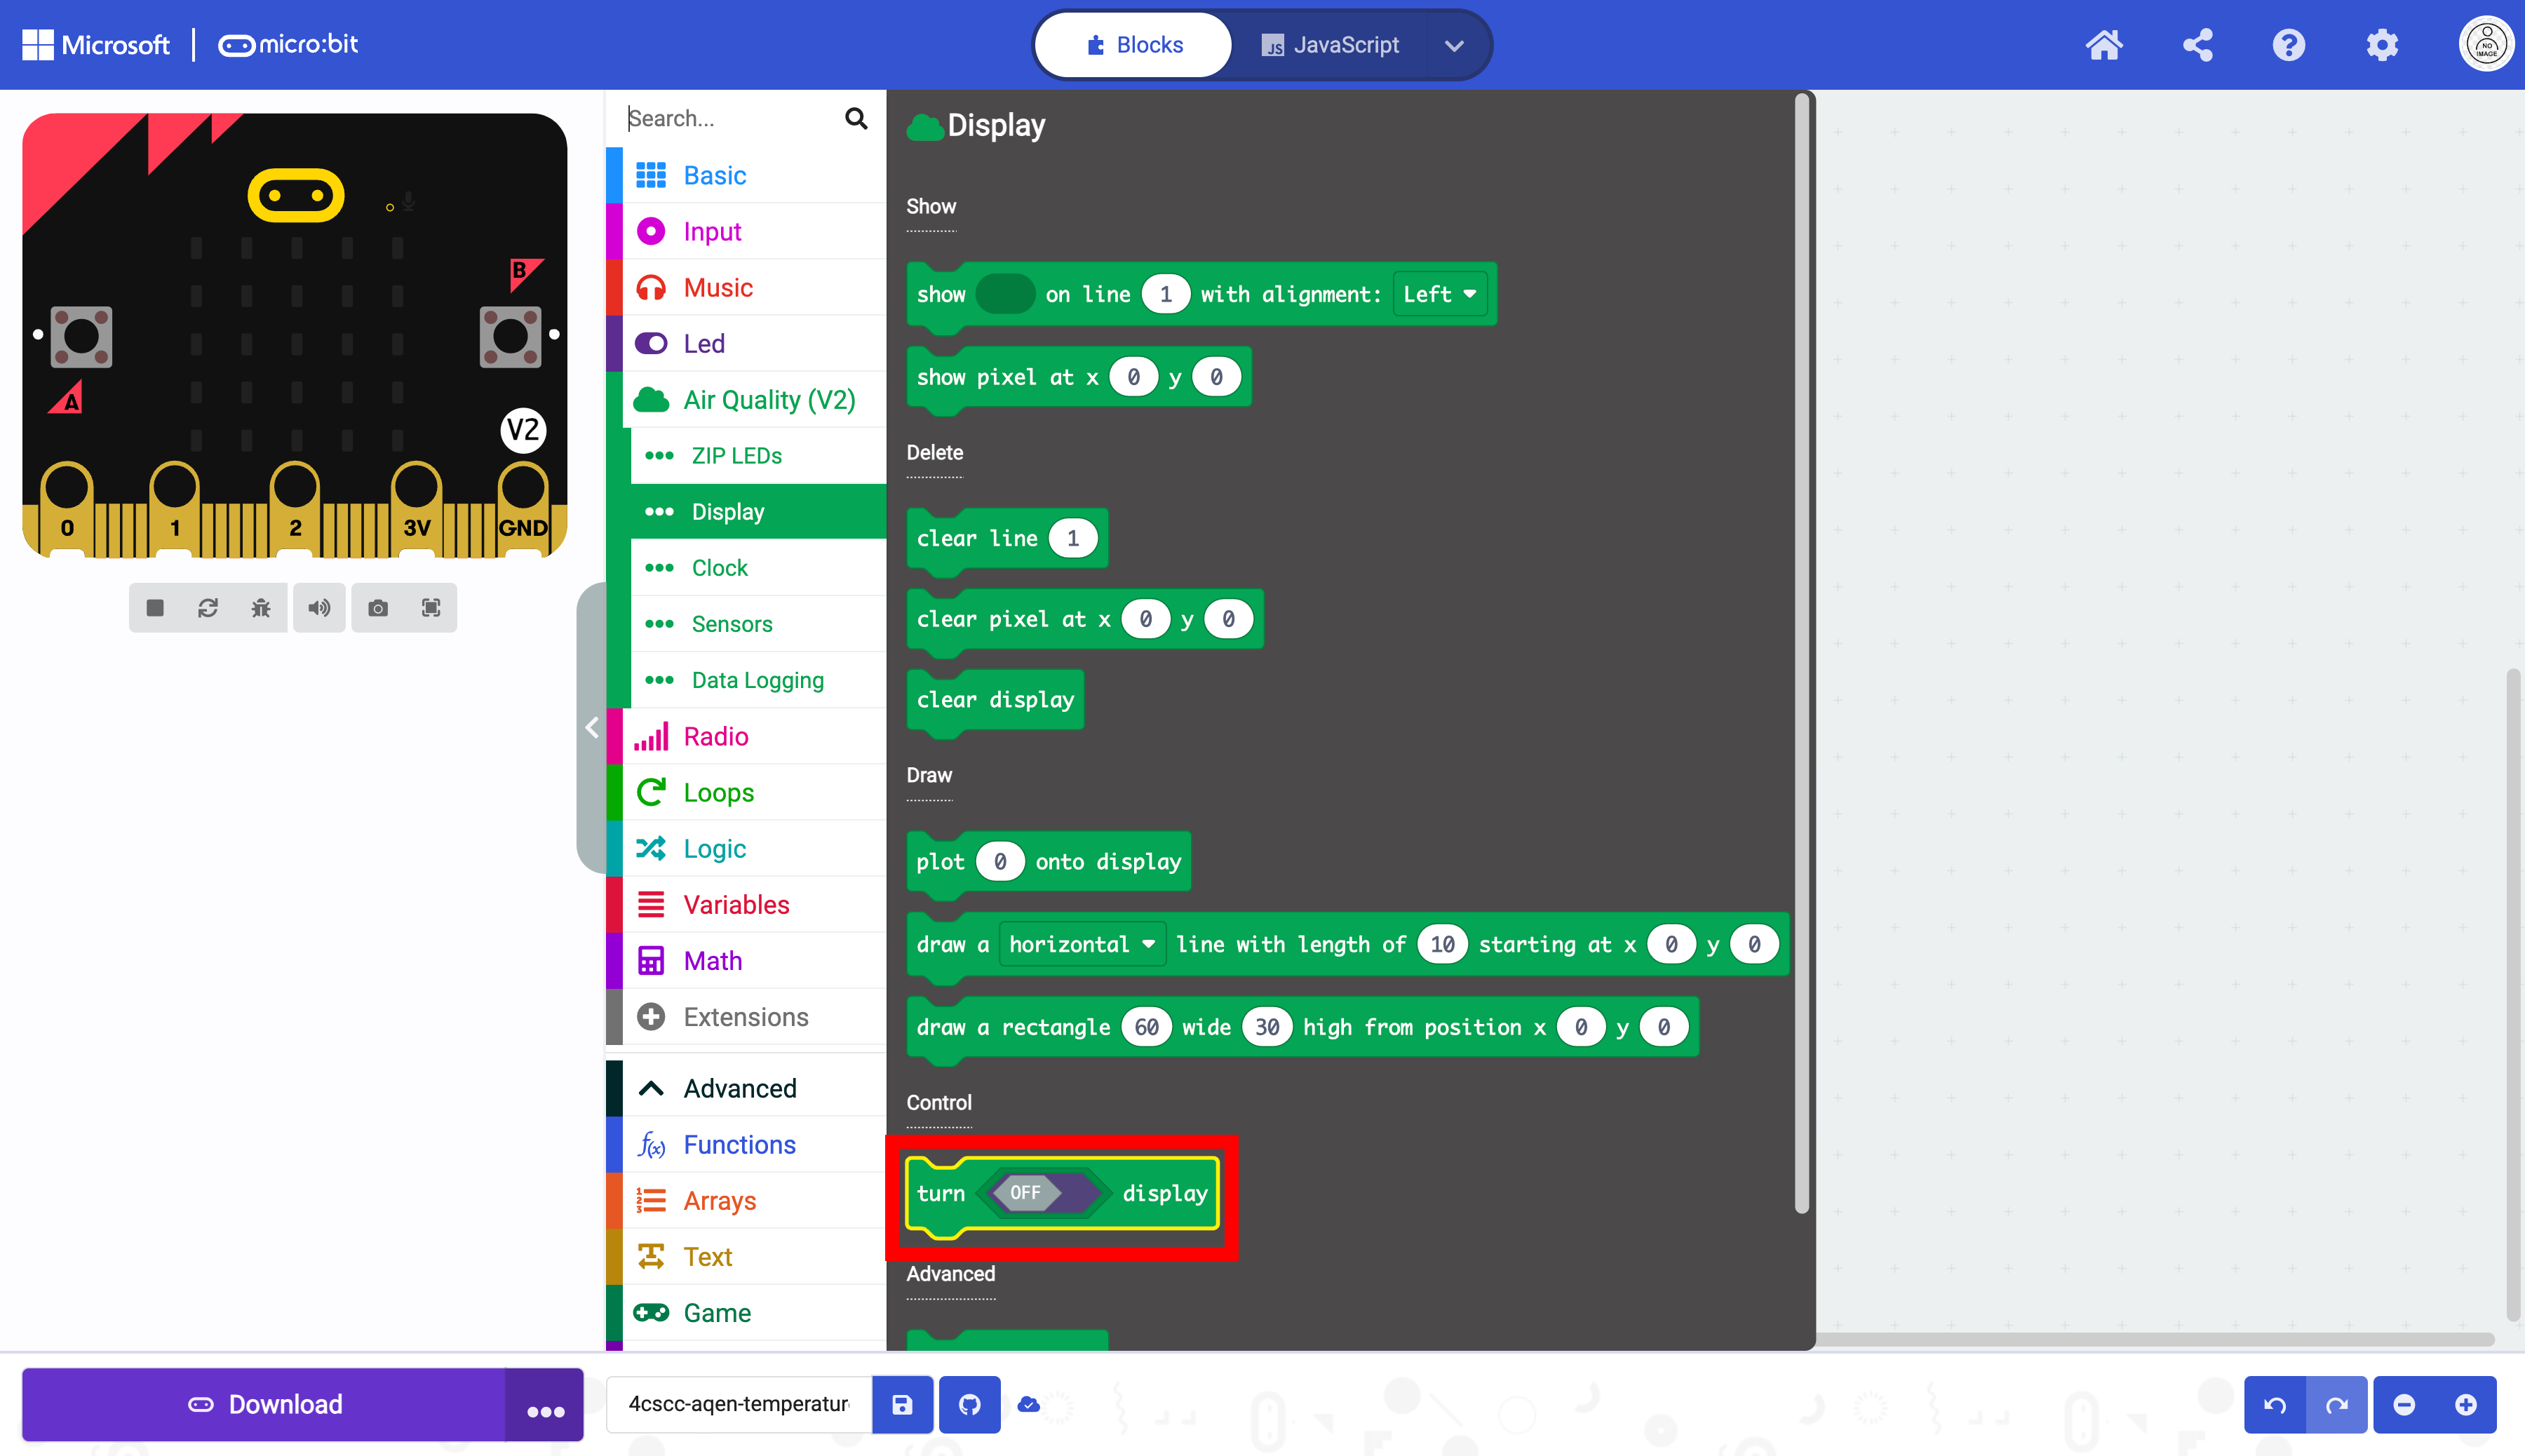
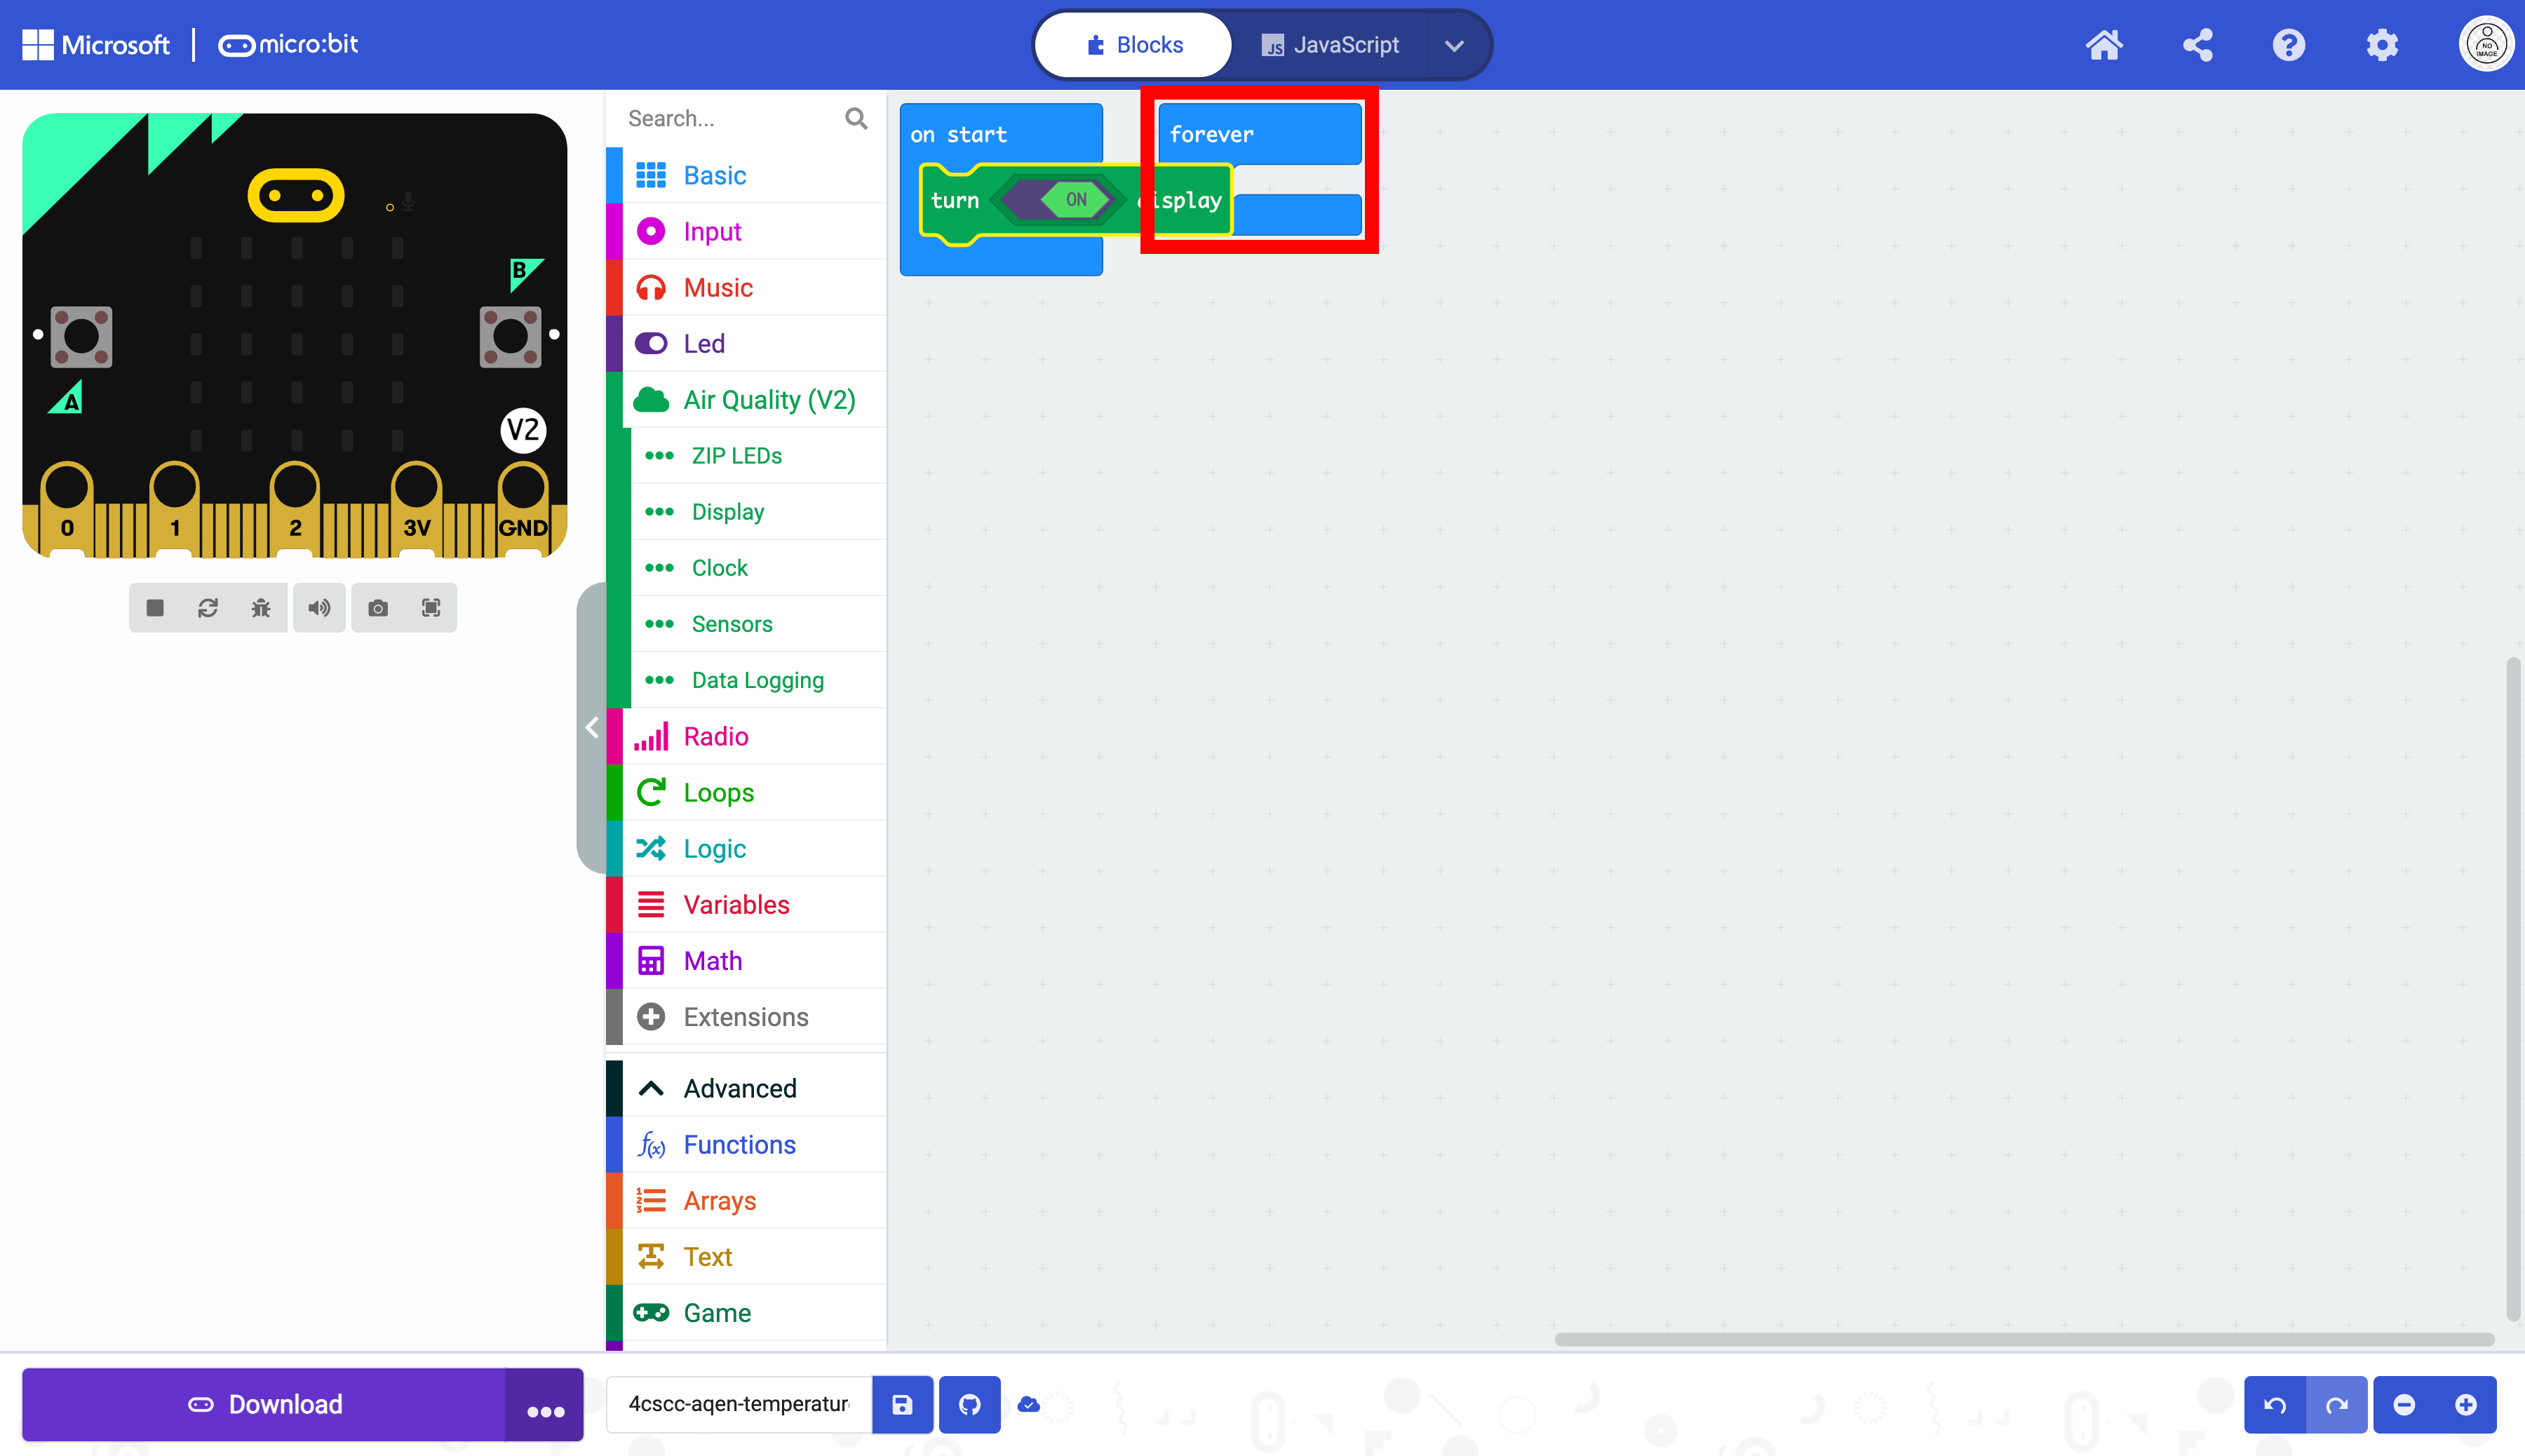
Select the turn off/on display block.
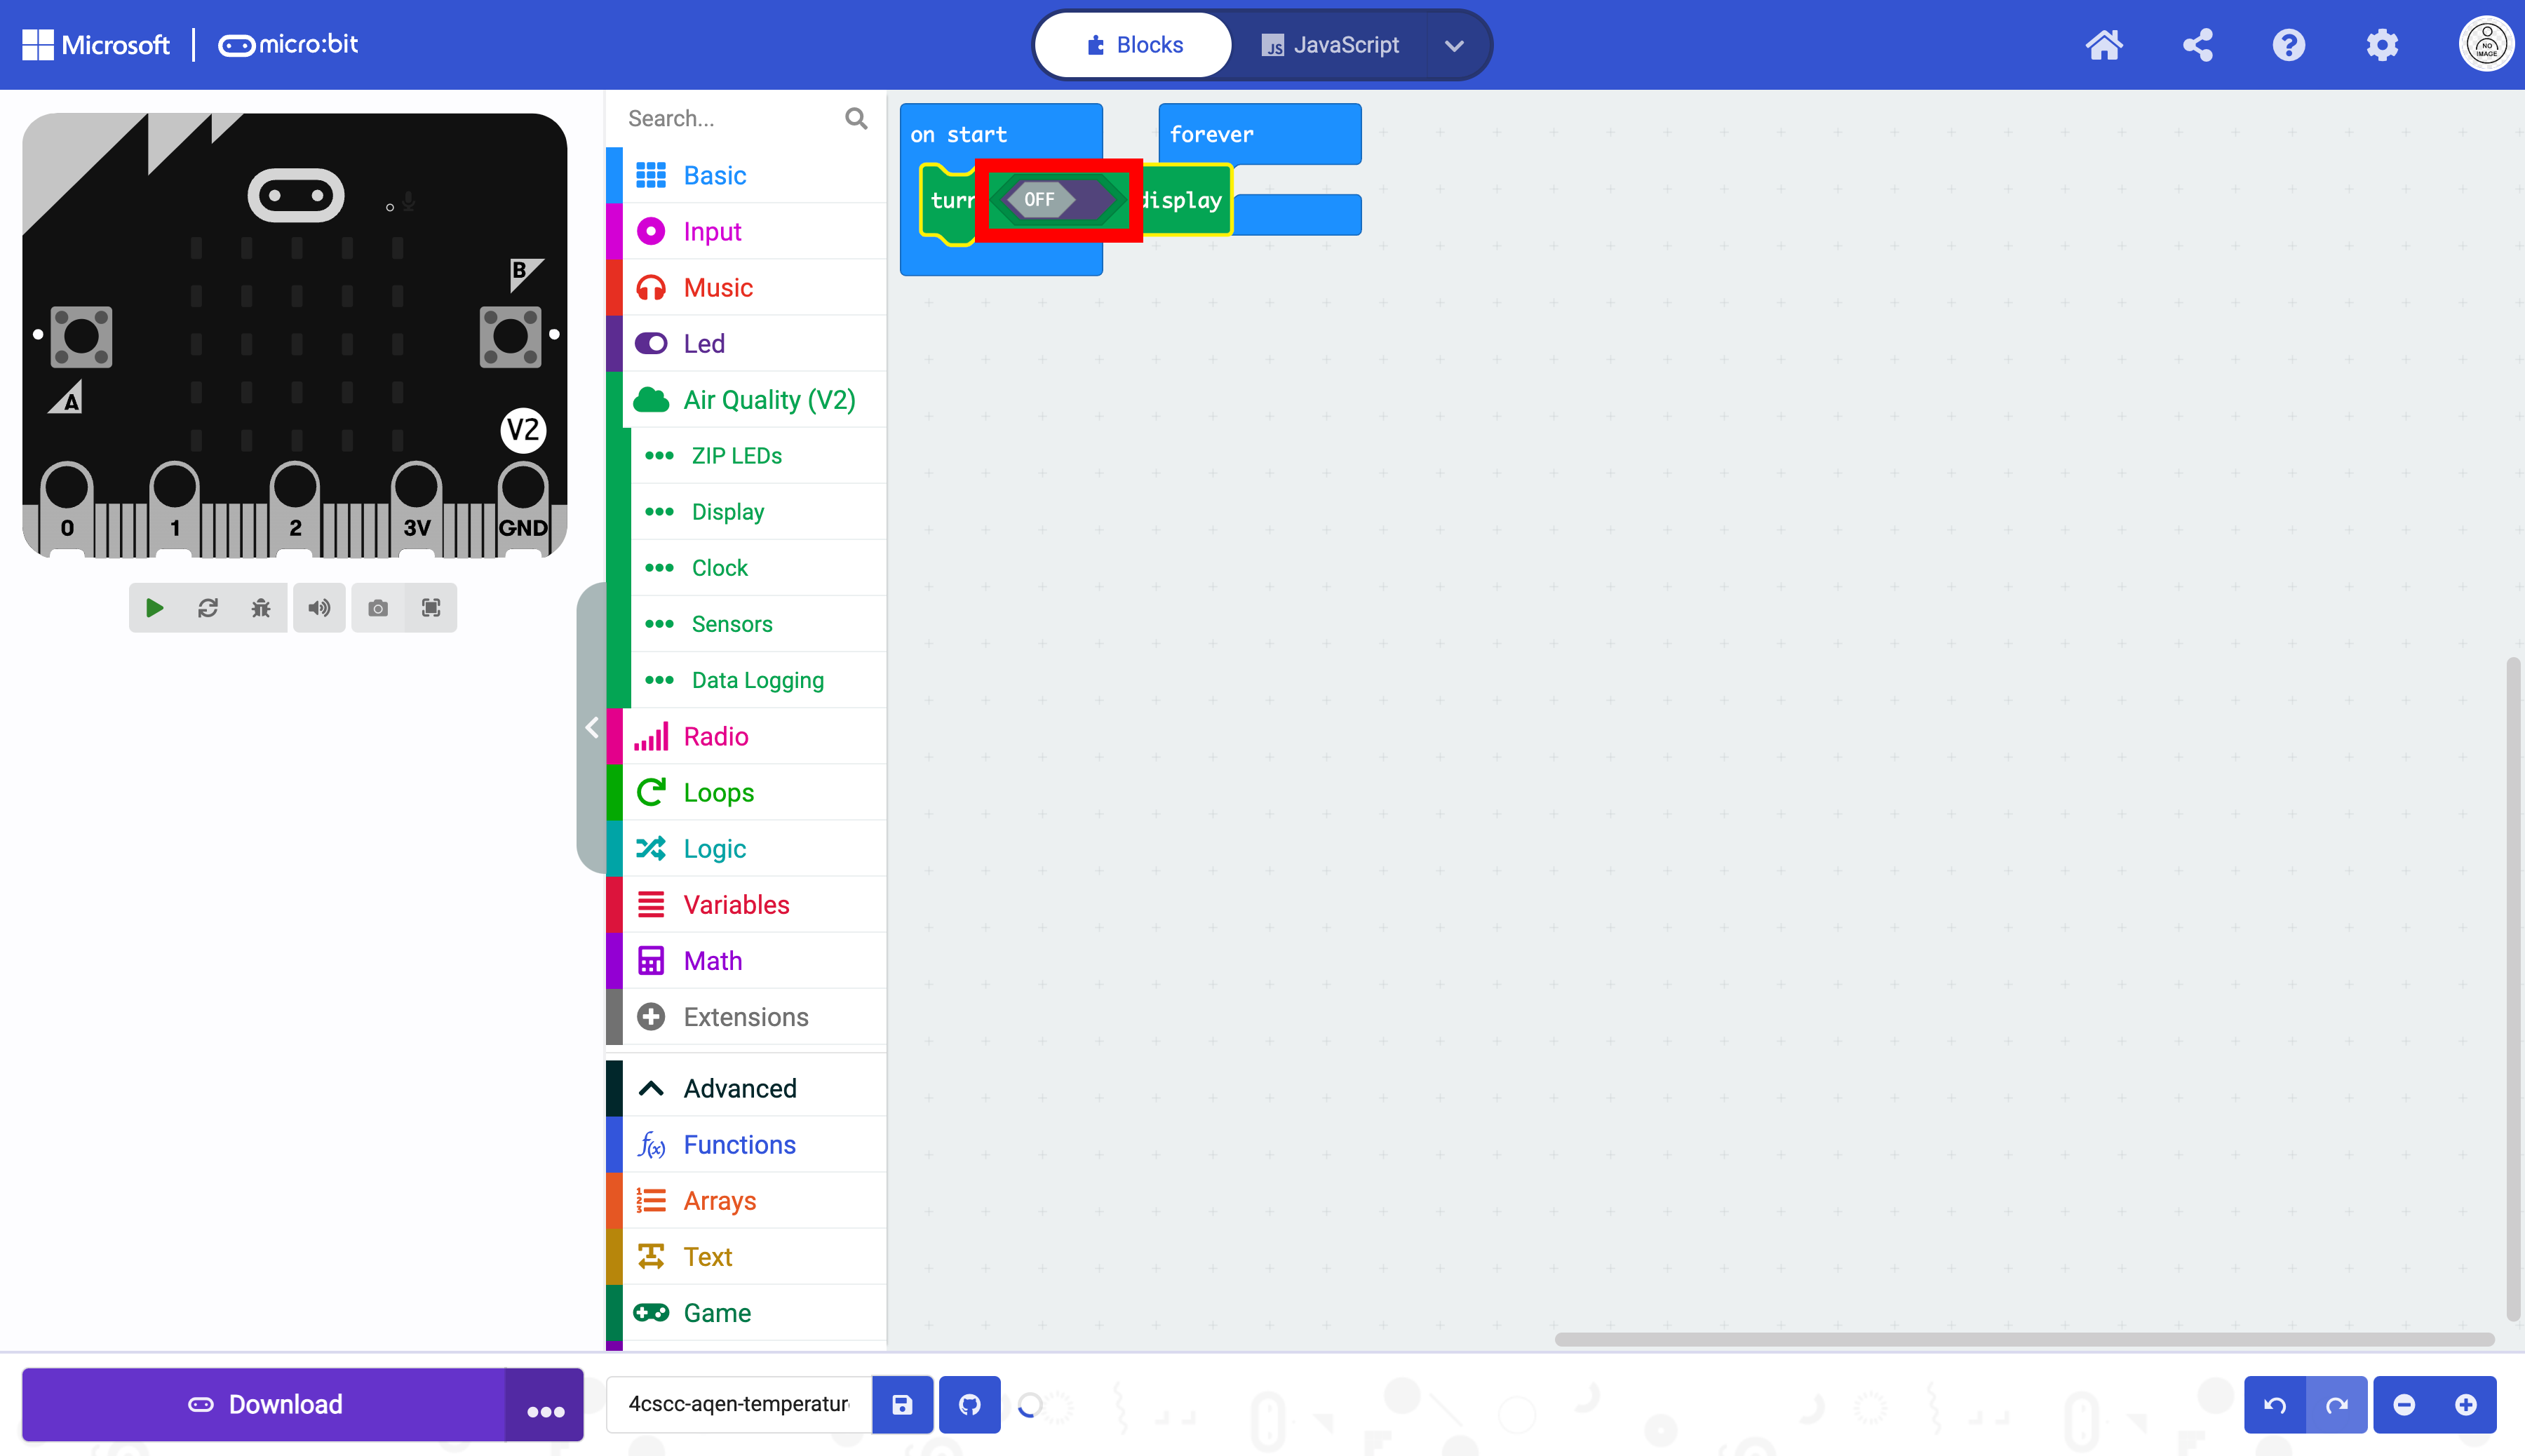
Drag the block into the forever block.

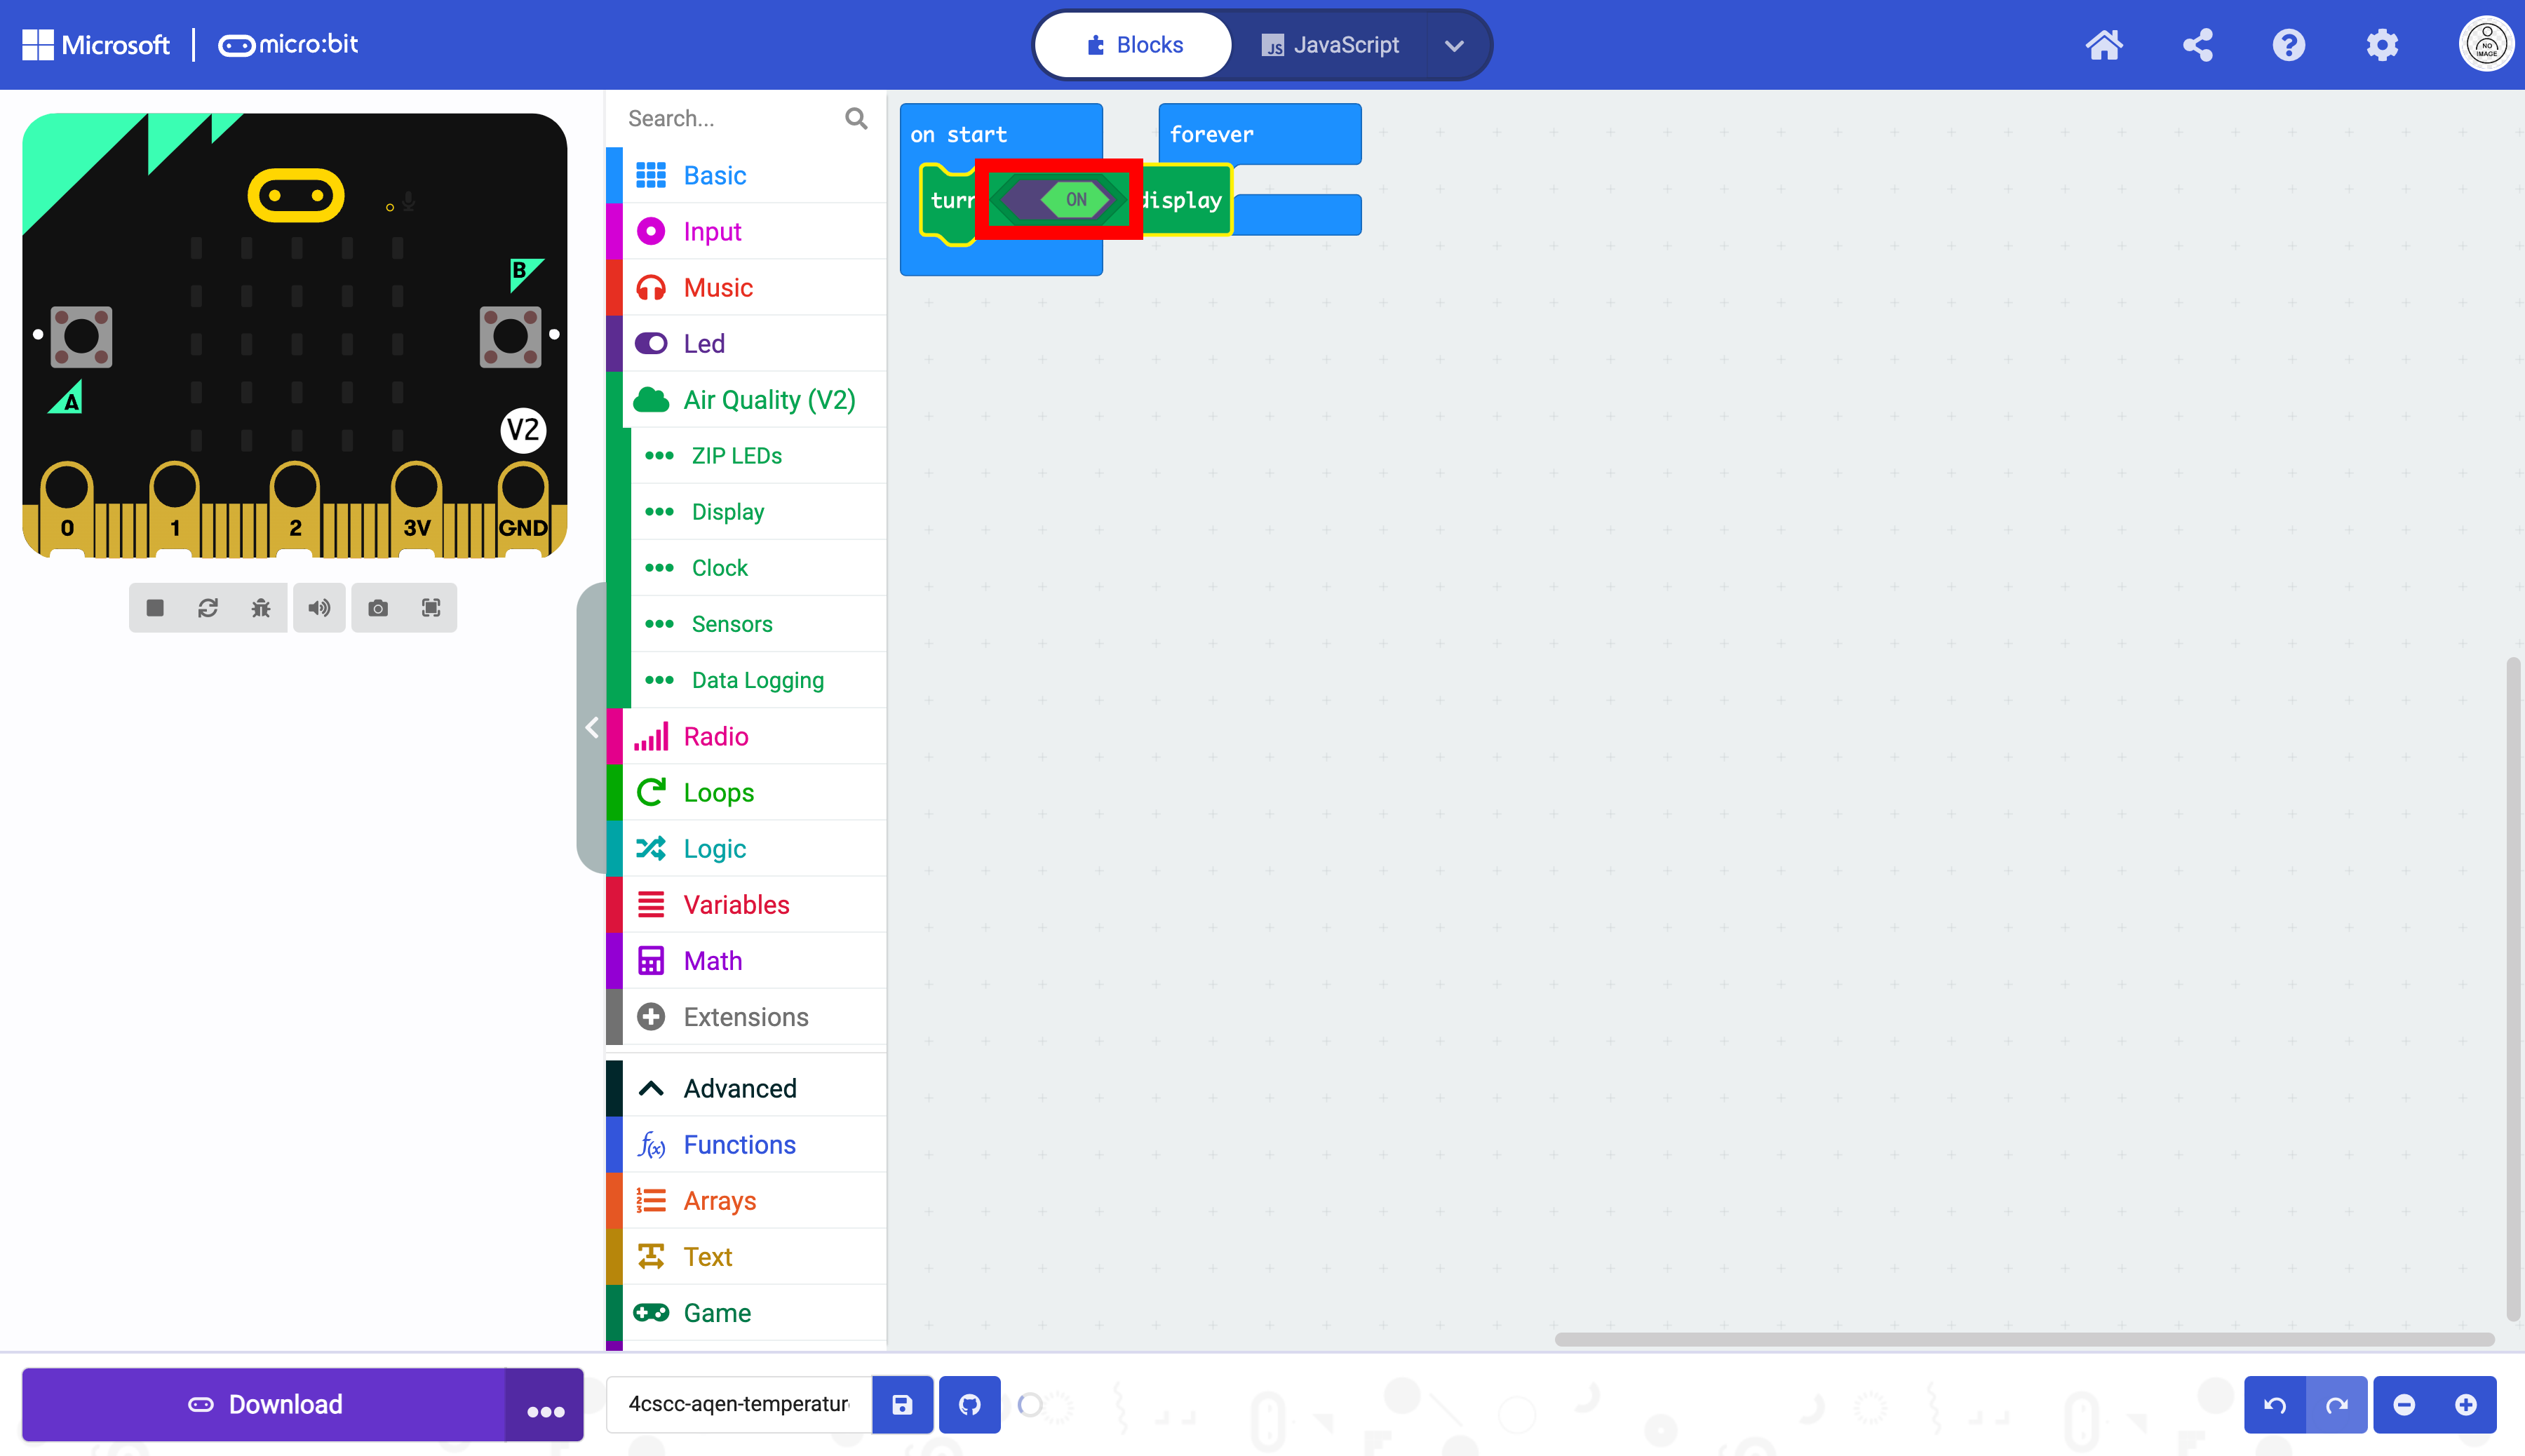
Toggle the off/on switch in the block.
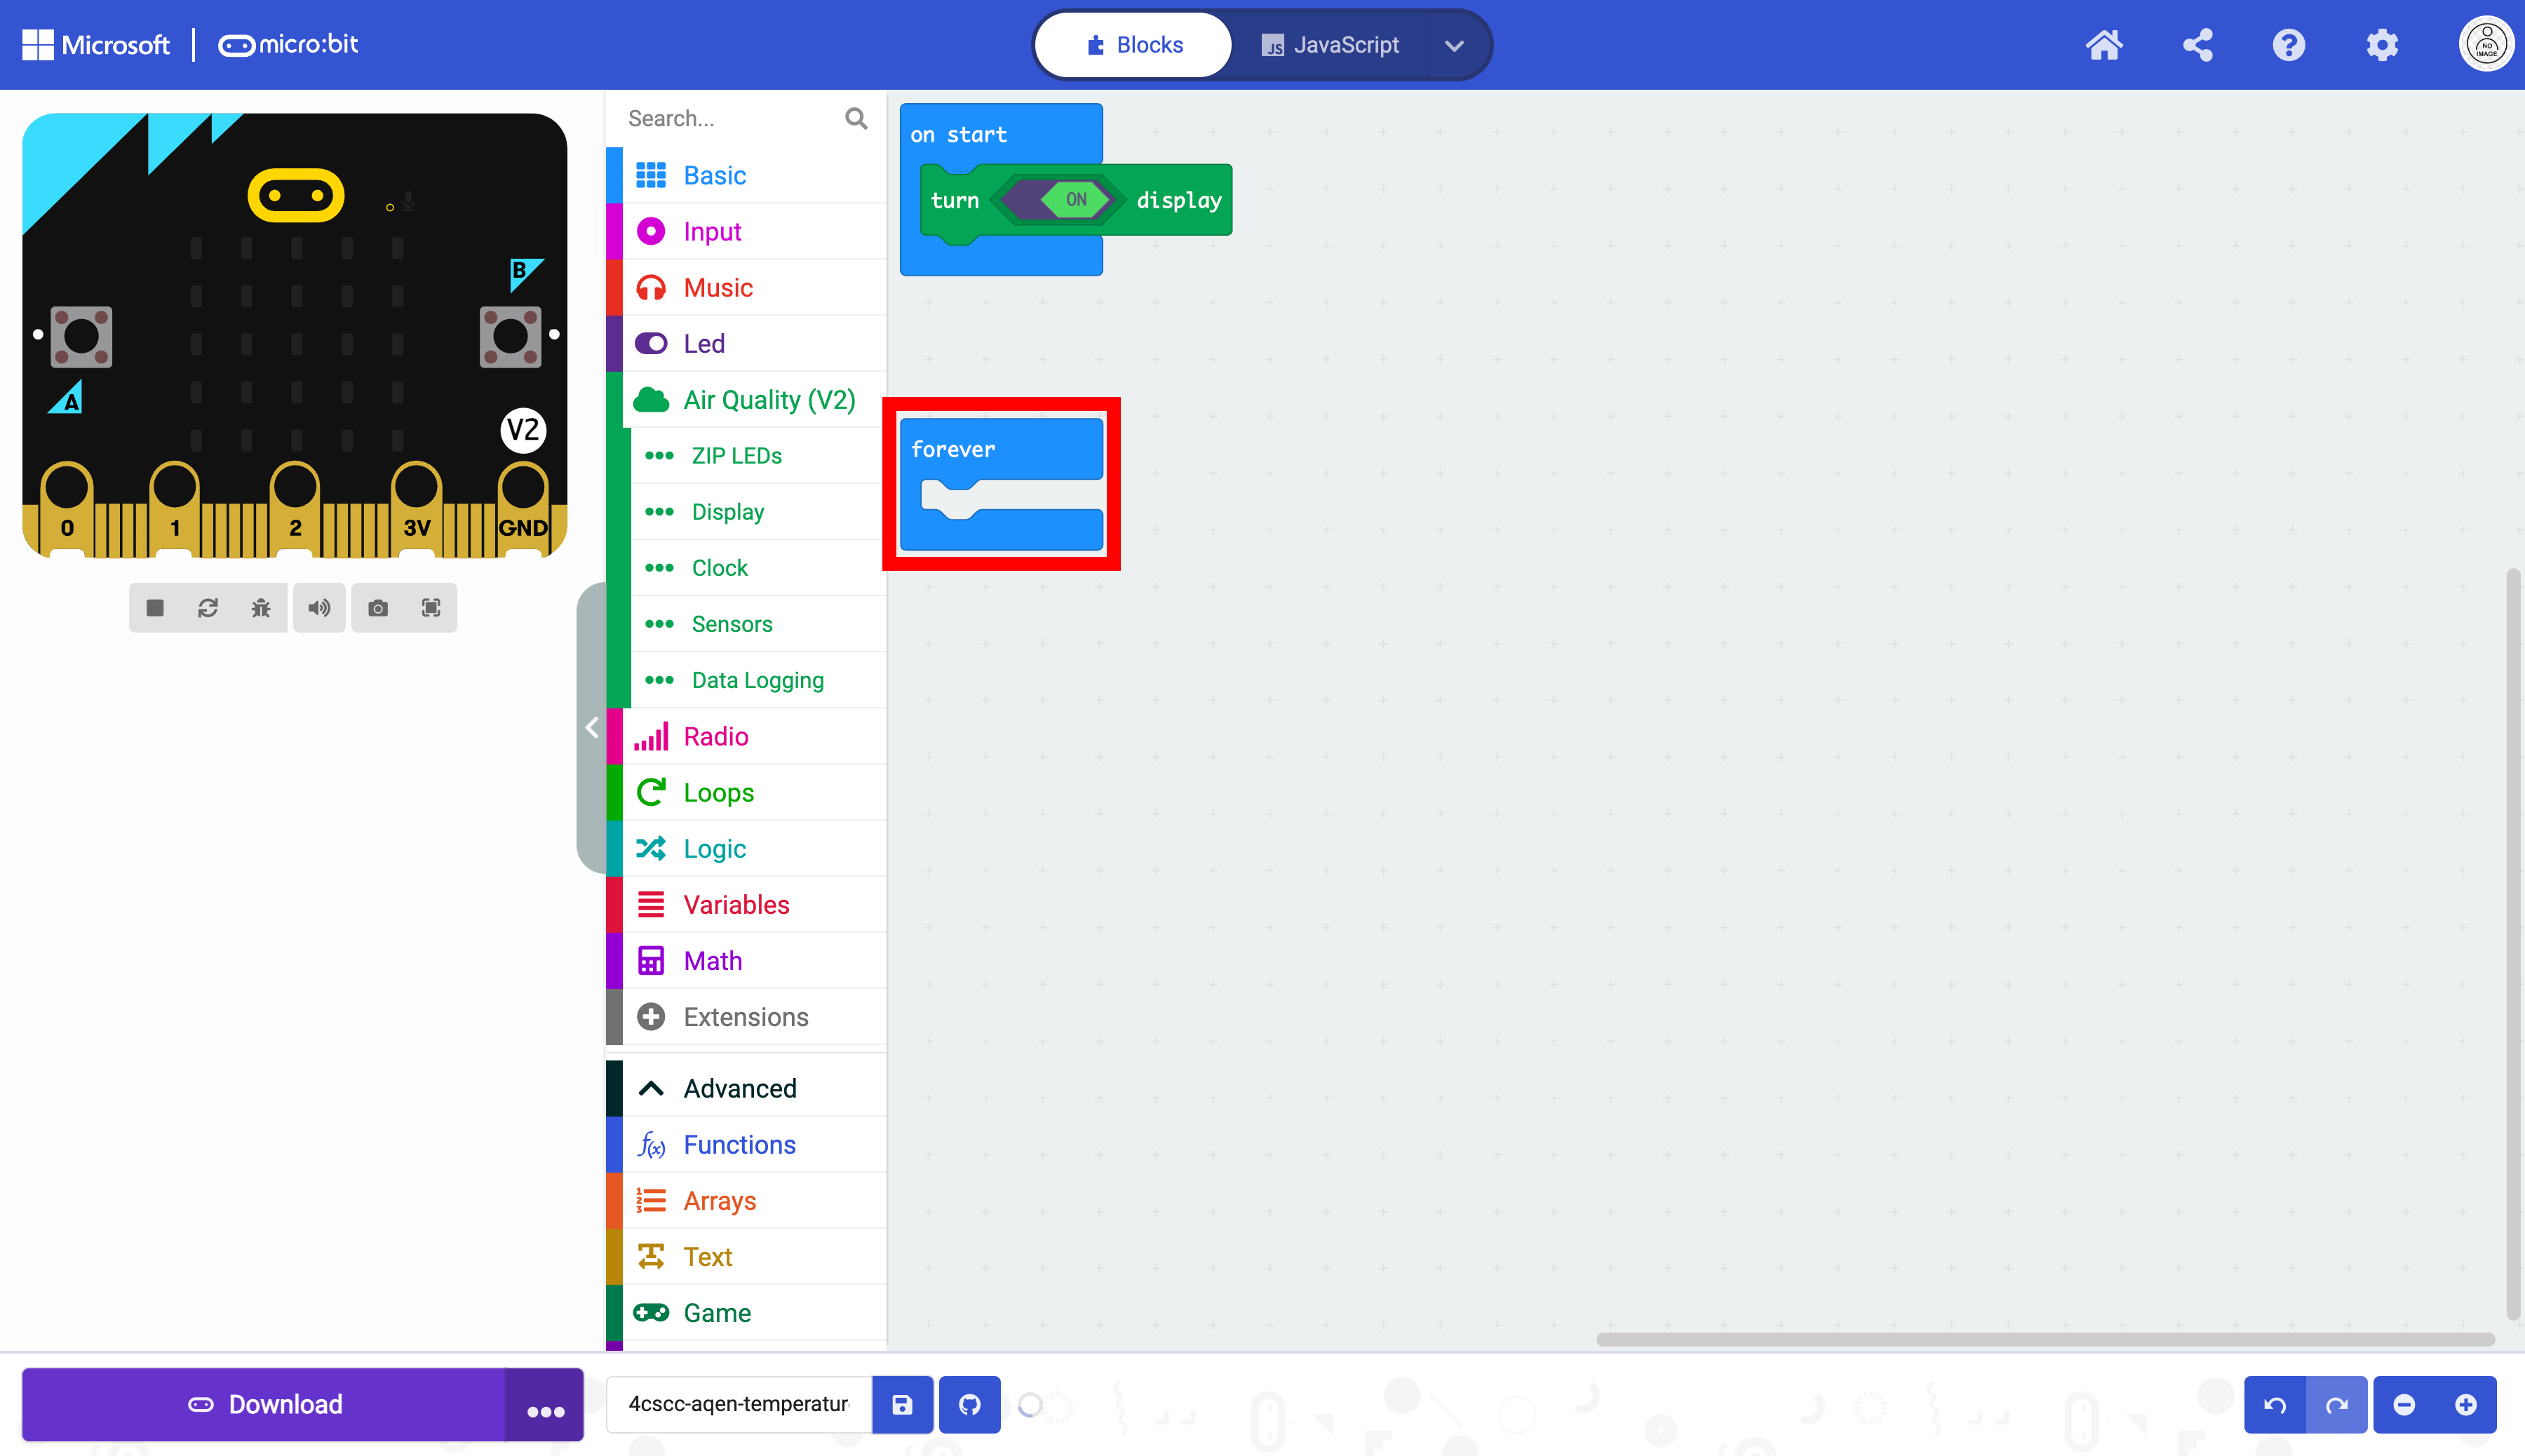
The display has been initialized and can be used.
Move the forever block.
It is now visible without obstruction.
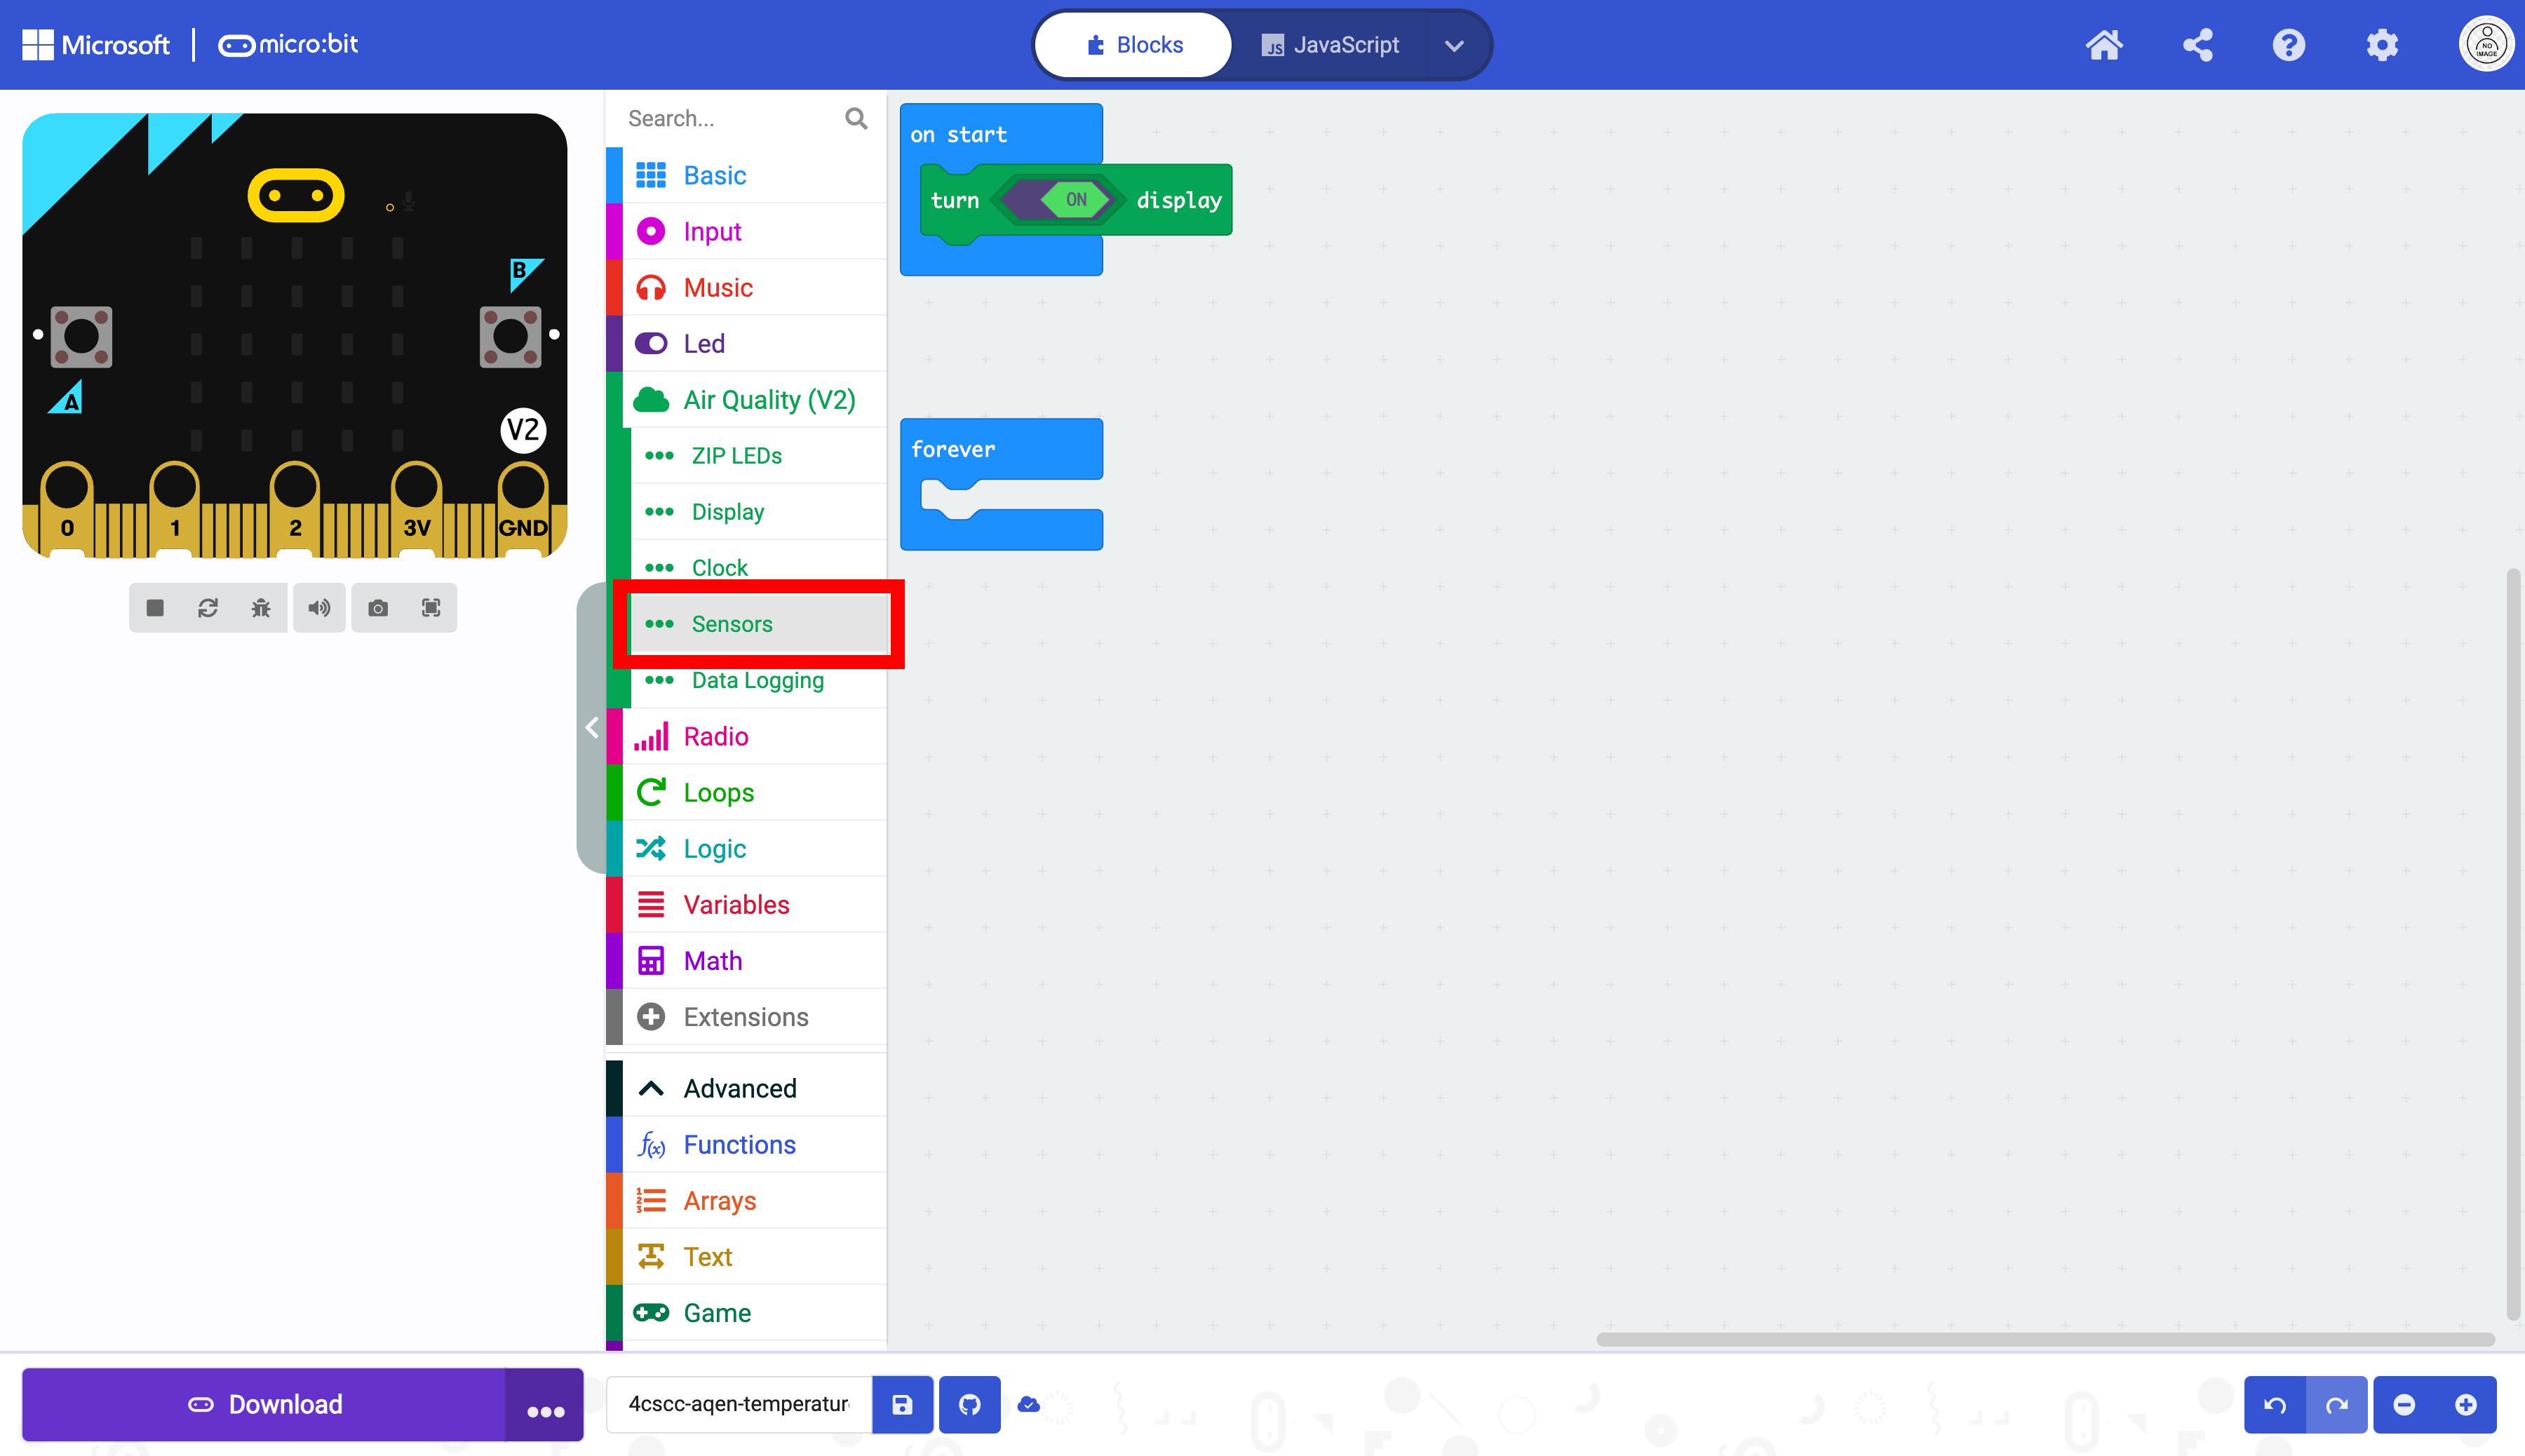
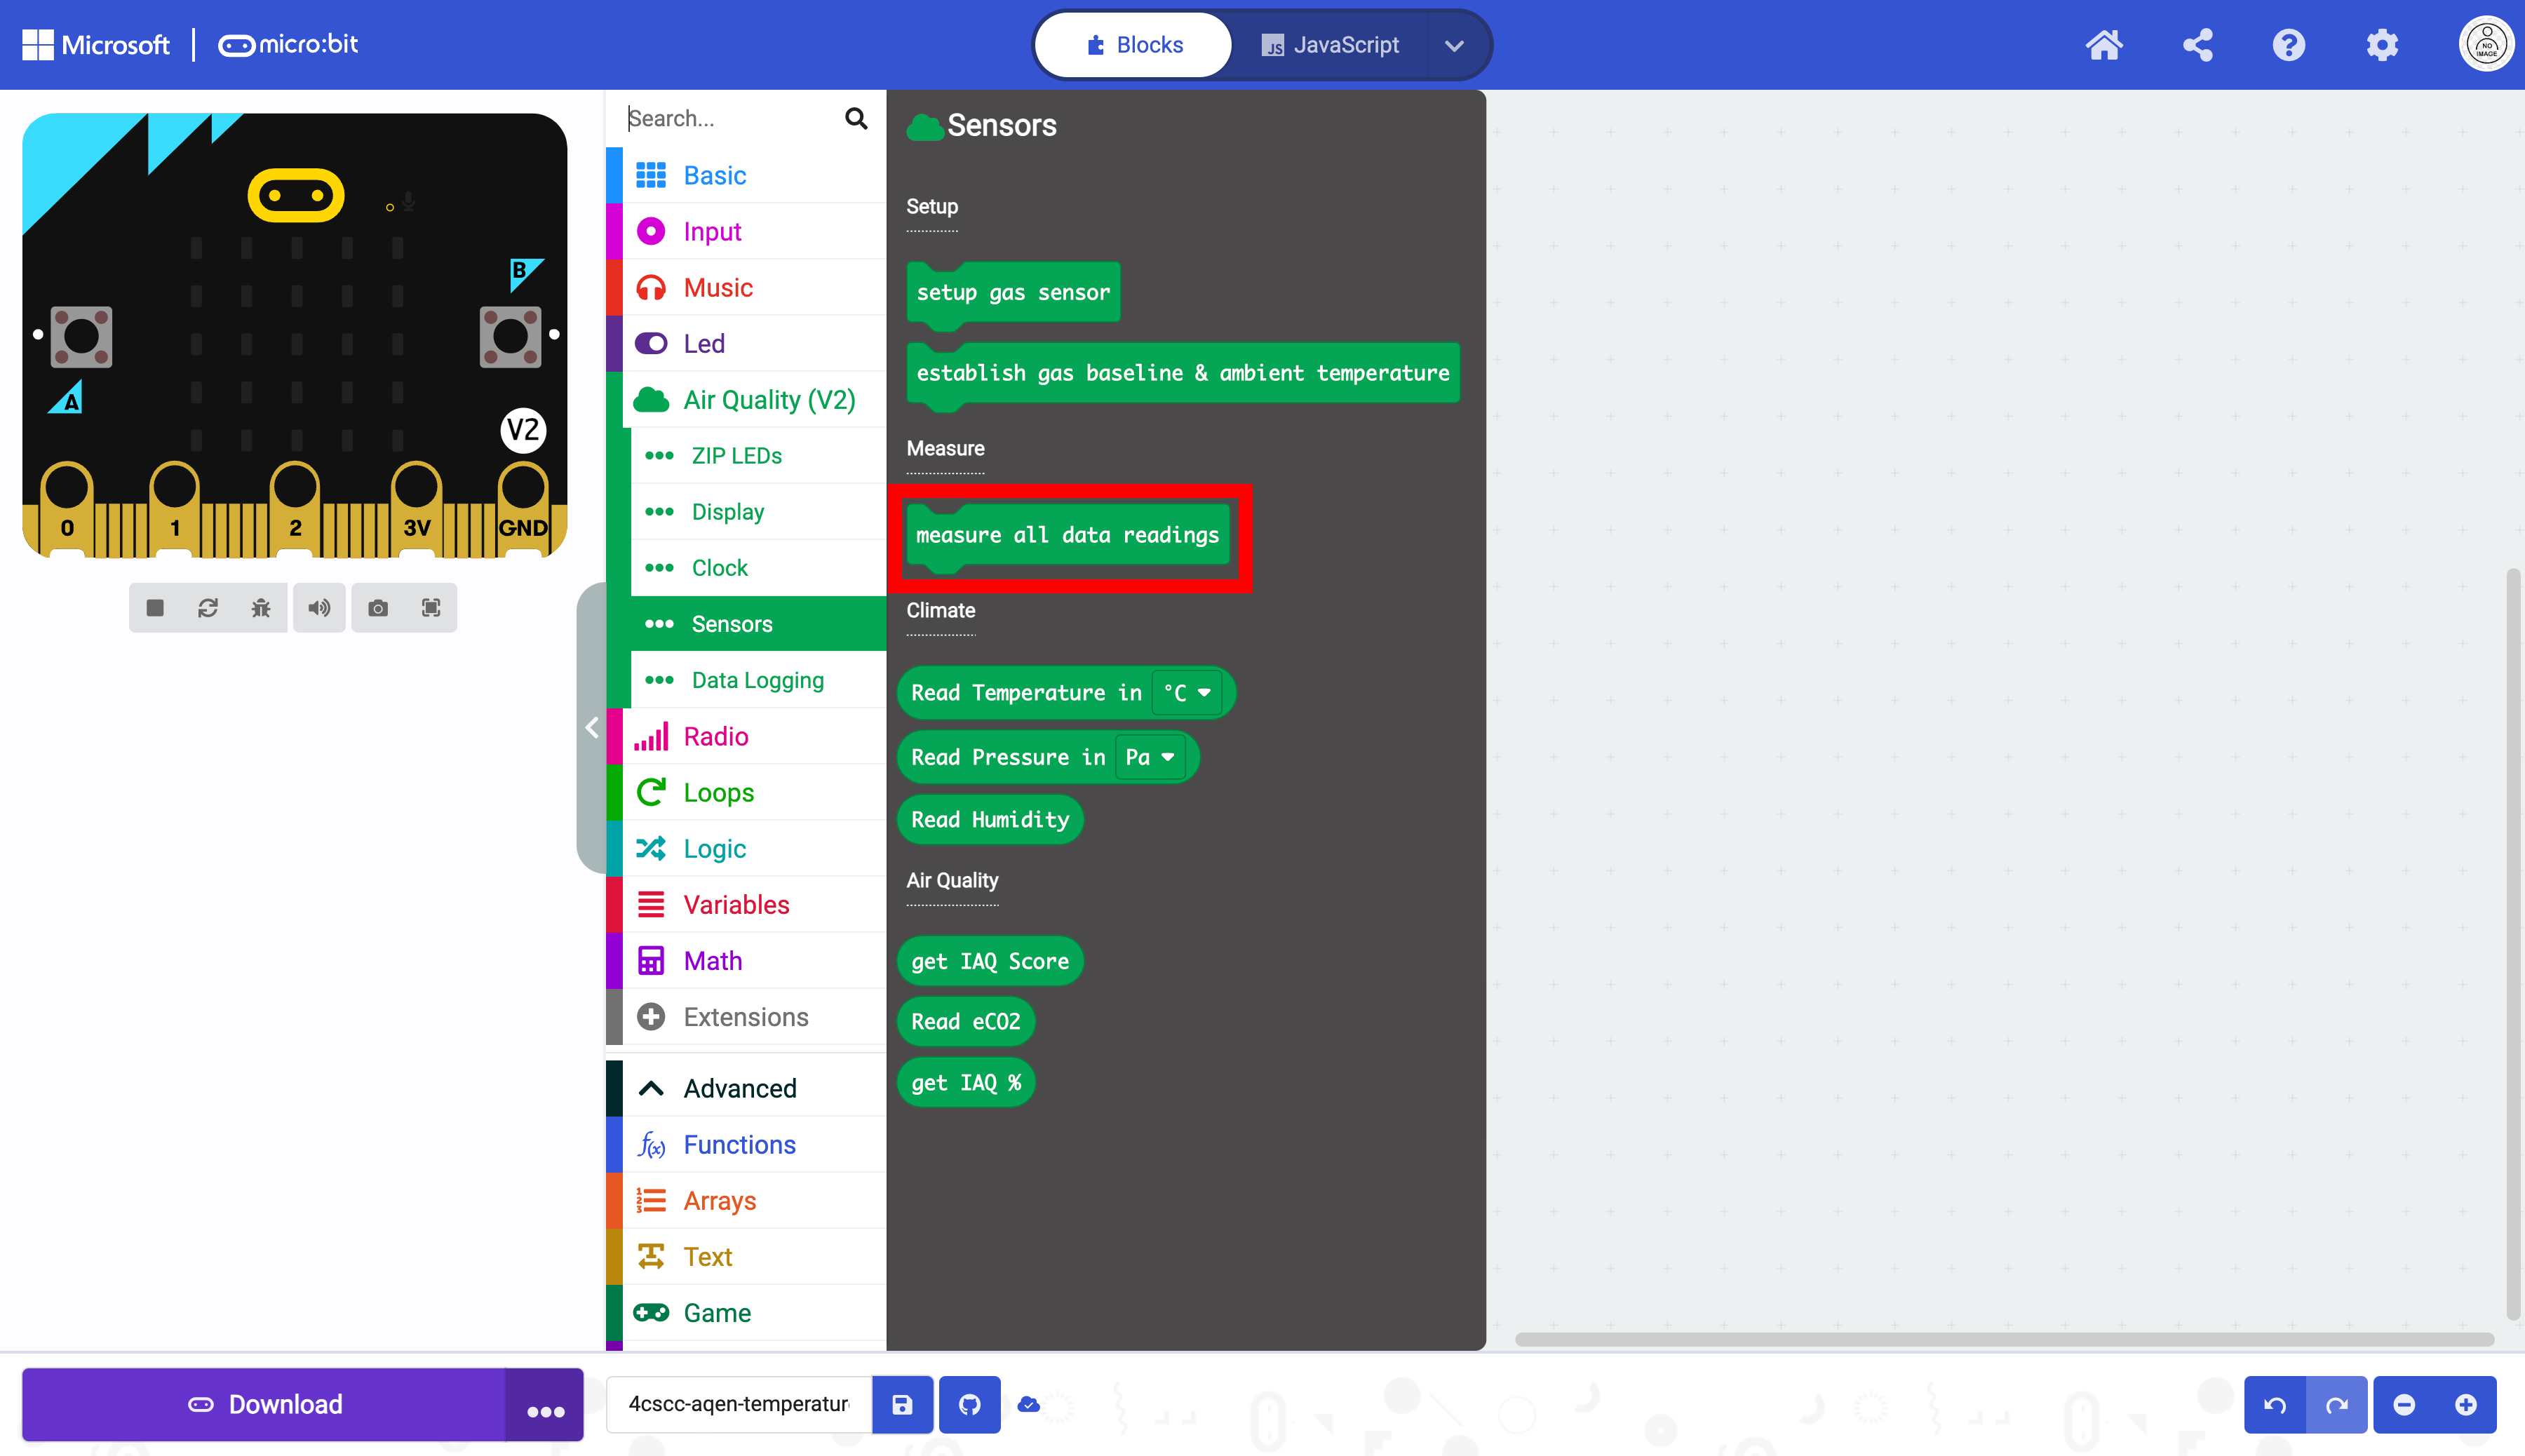
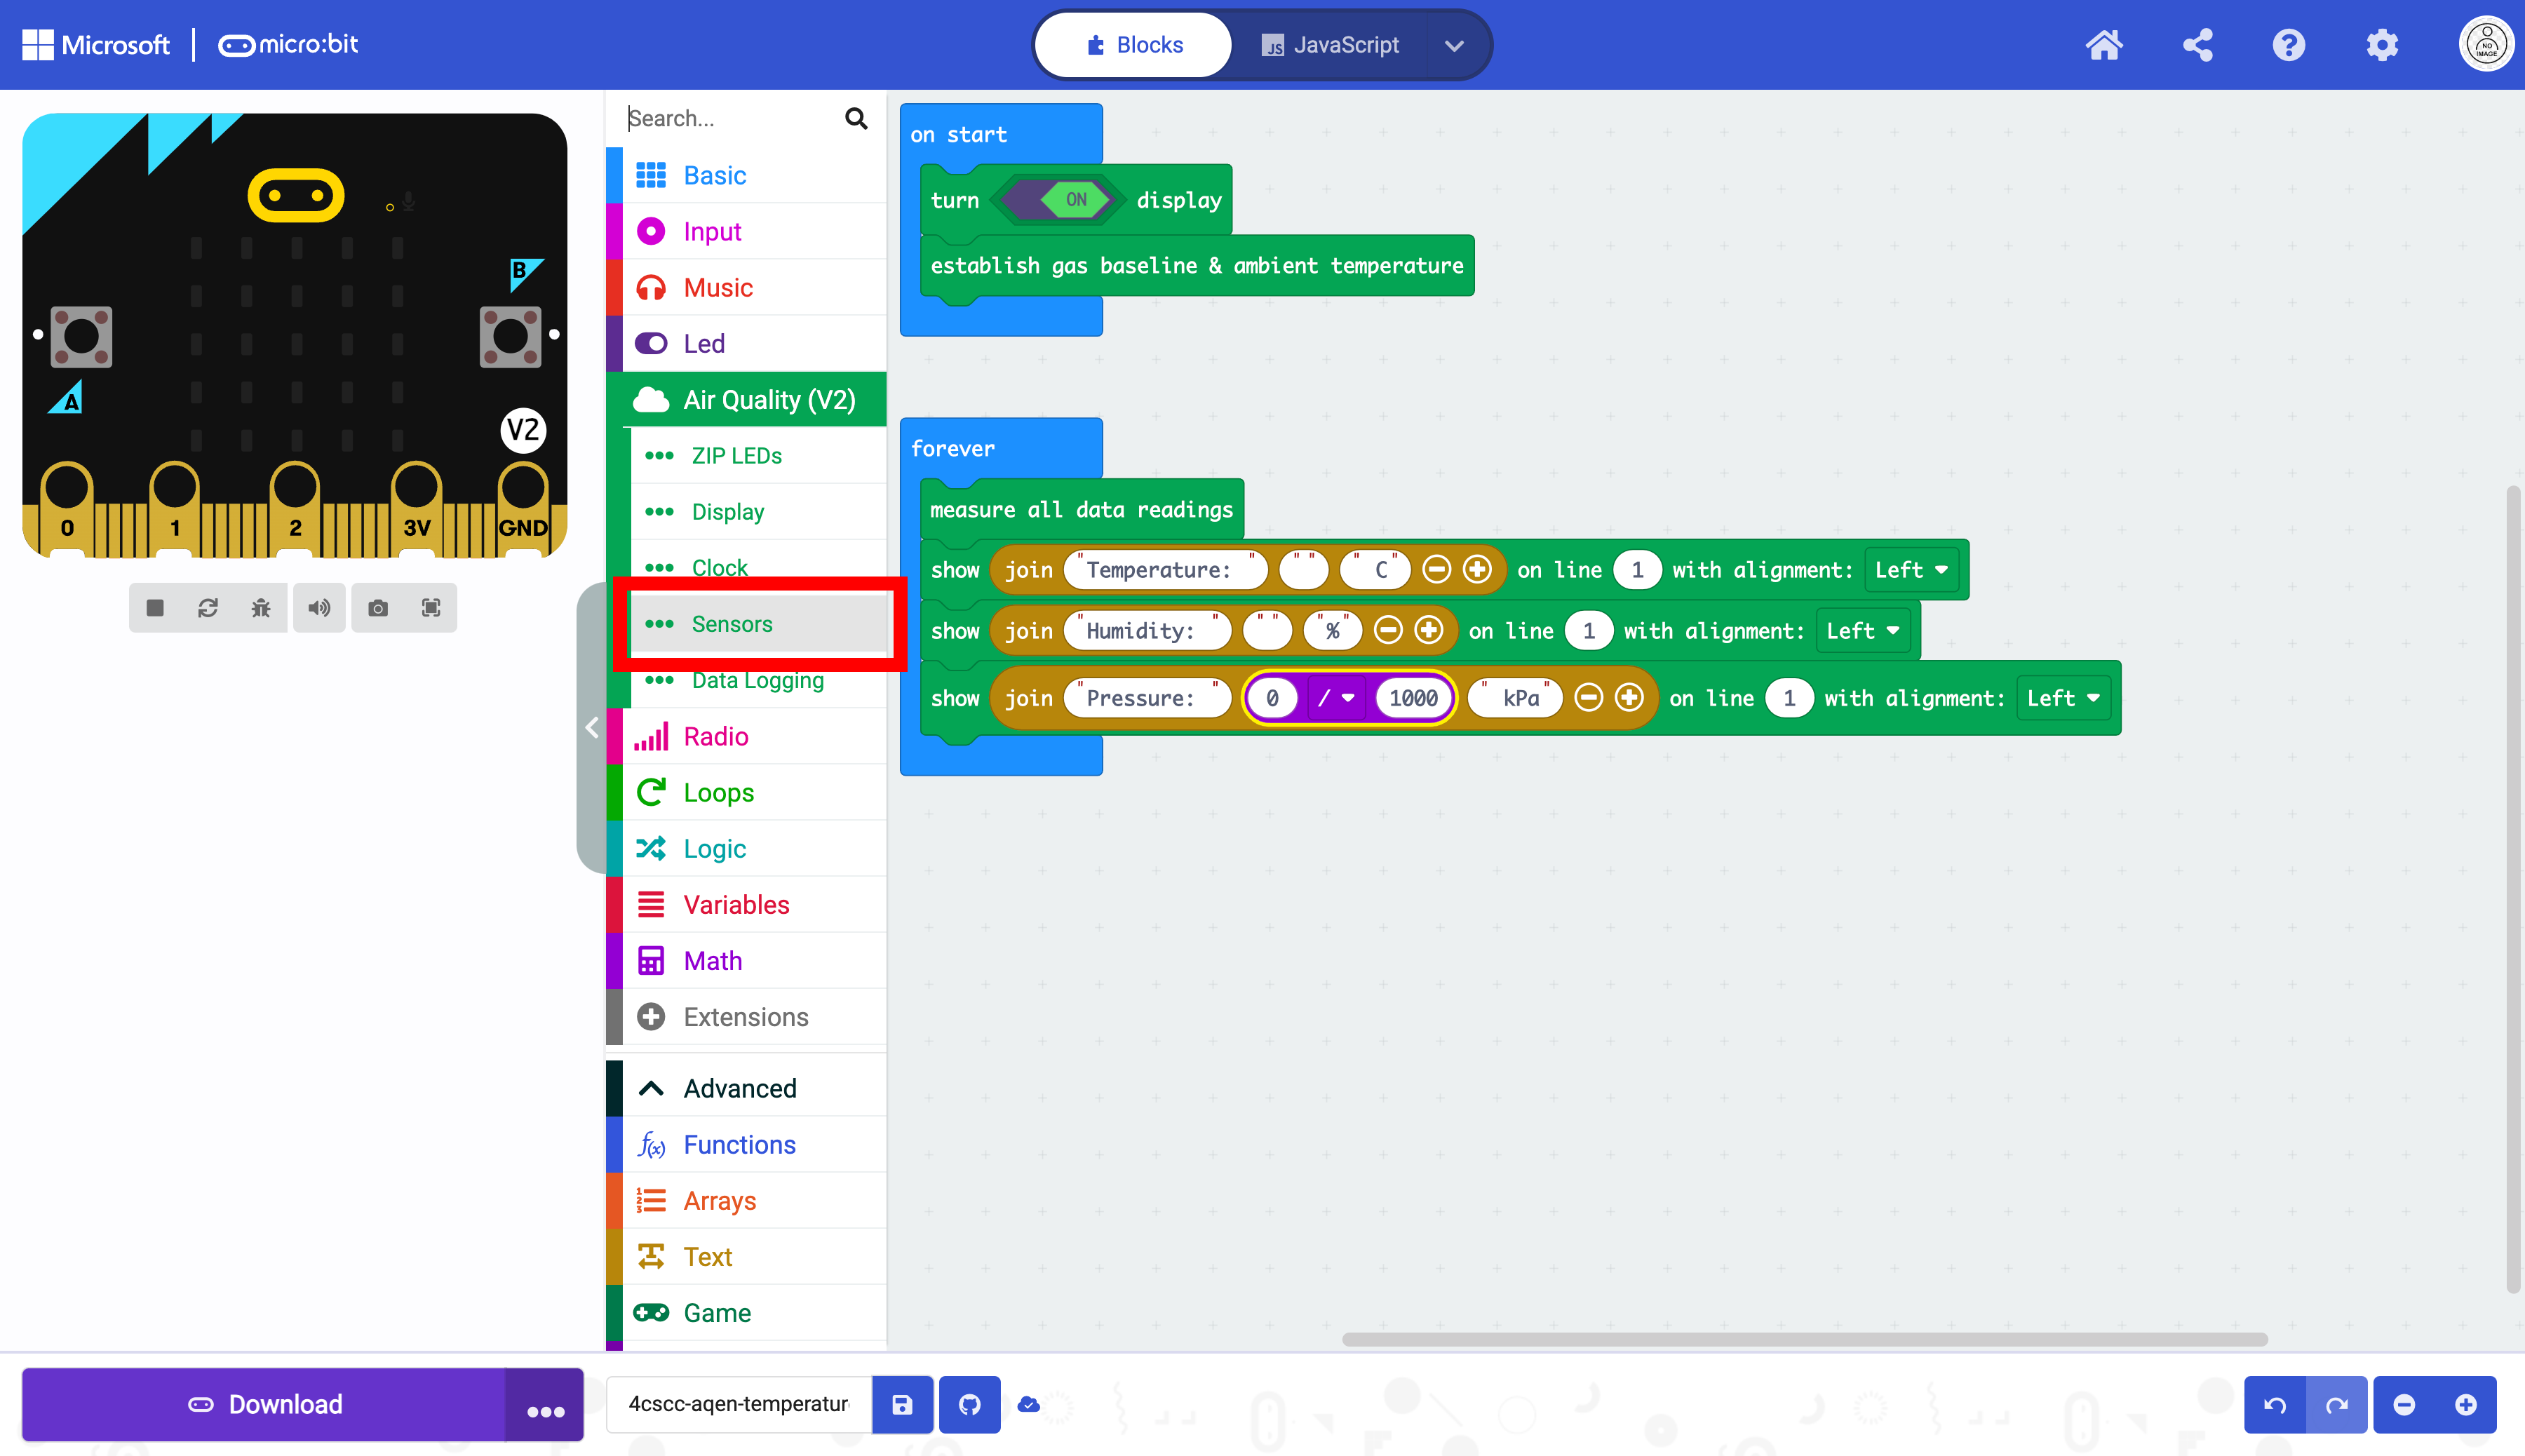
Select the “Sensor” drawer.
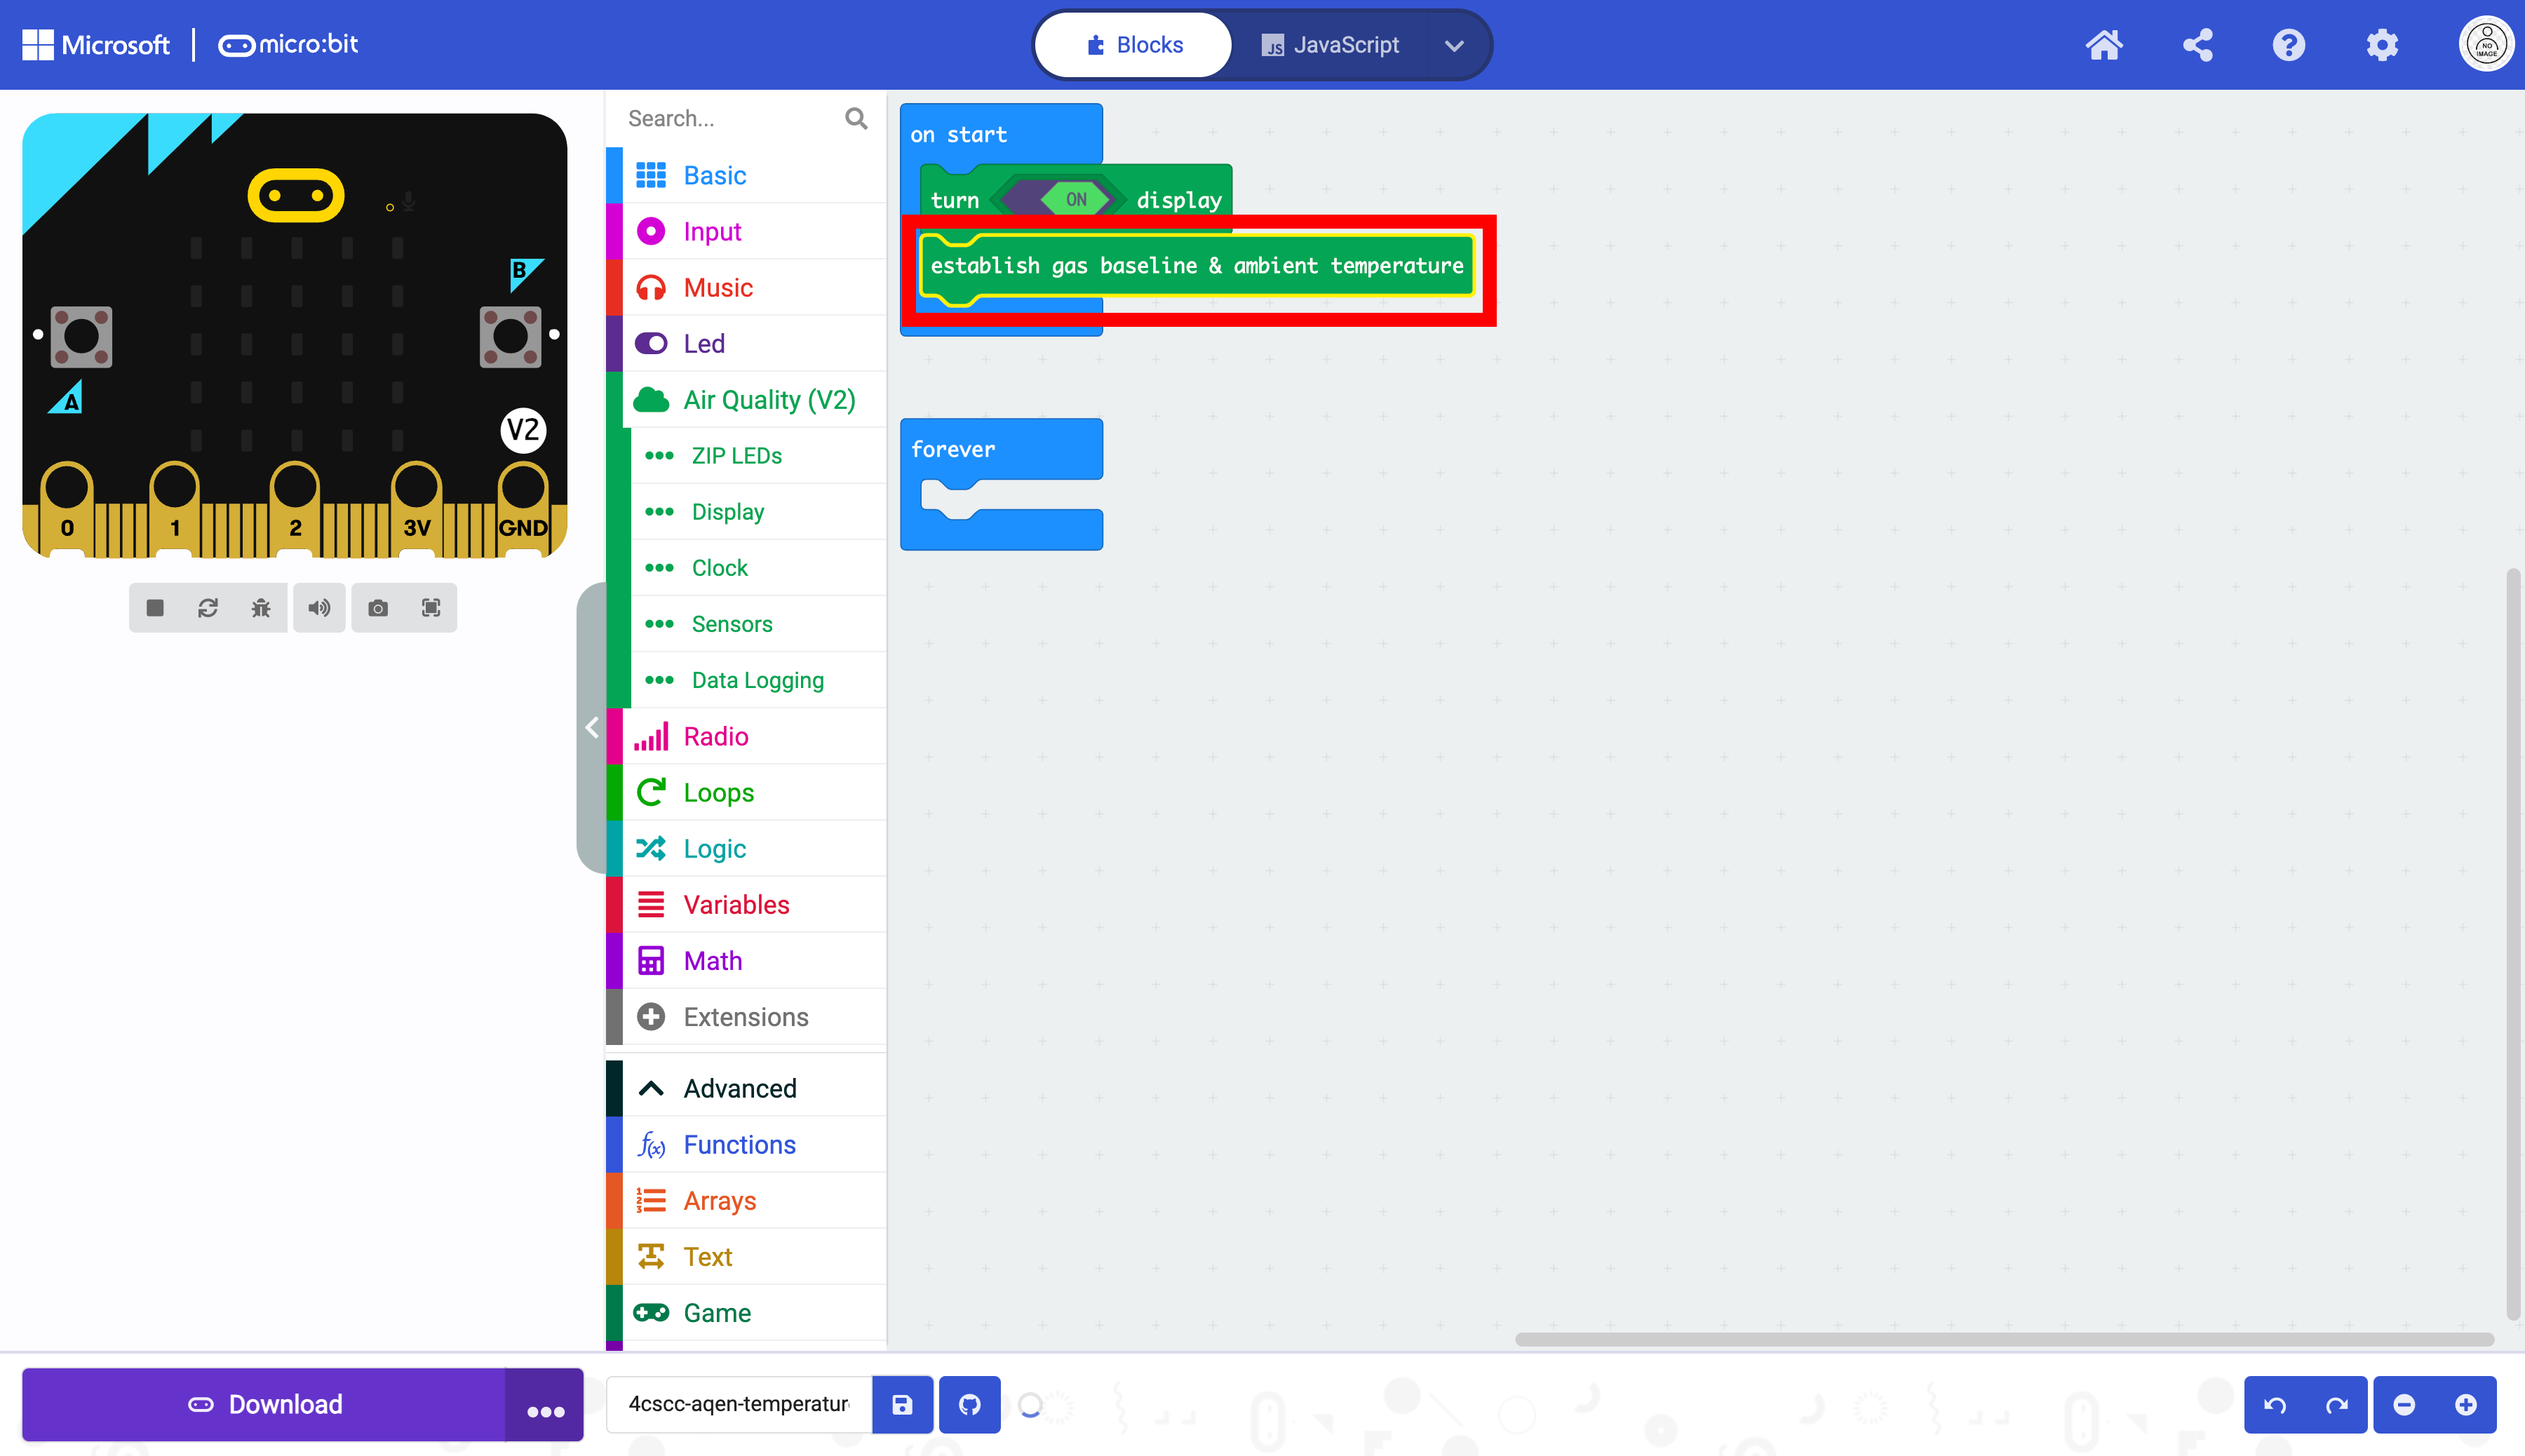
Here you can find the establish gas baseline & ambient temperature block. This block helps the sensors gather more accurate air quality data.
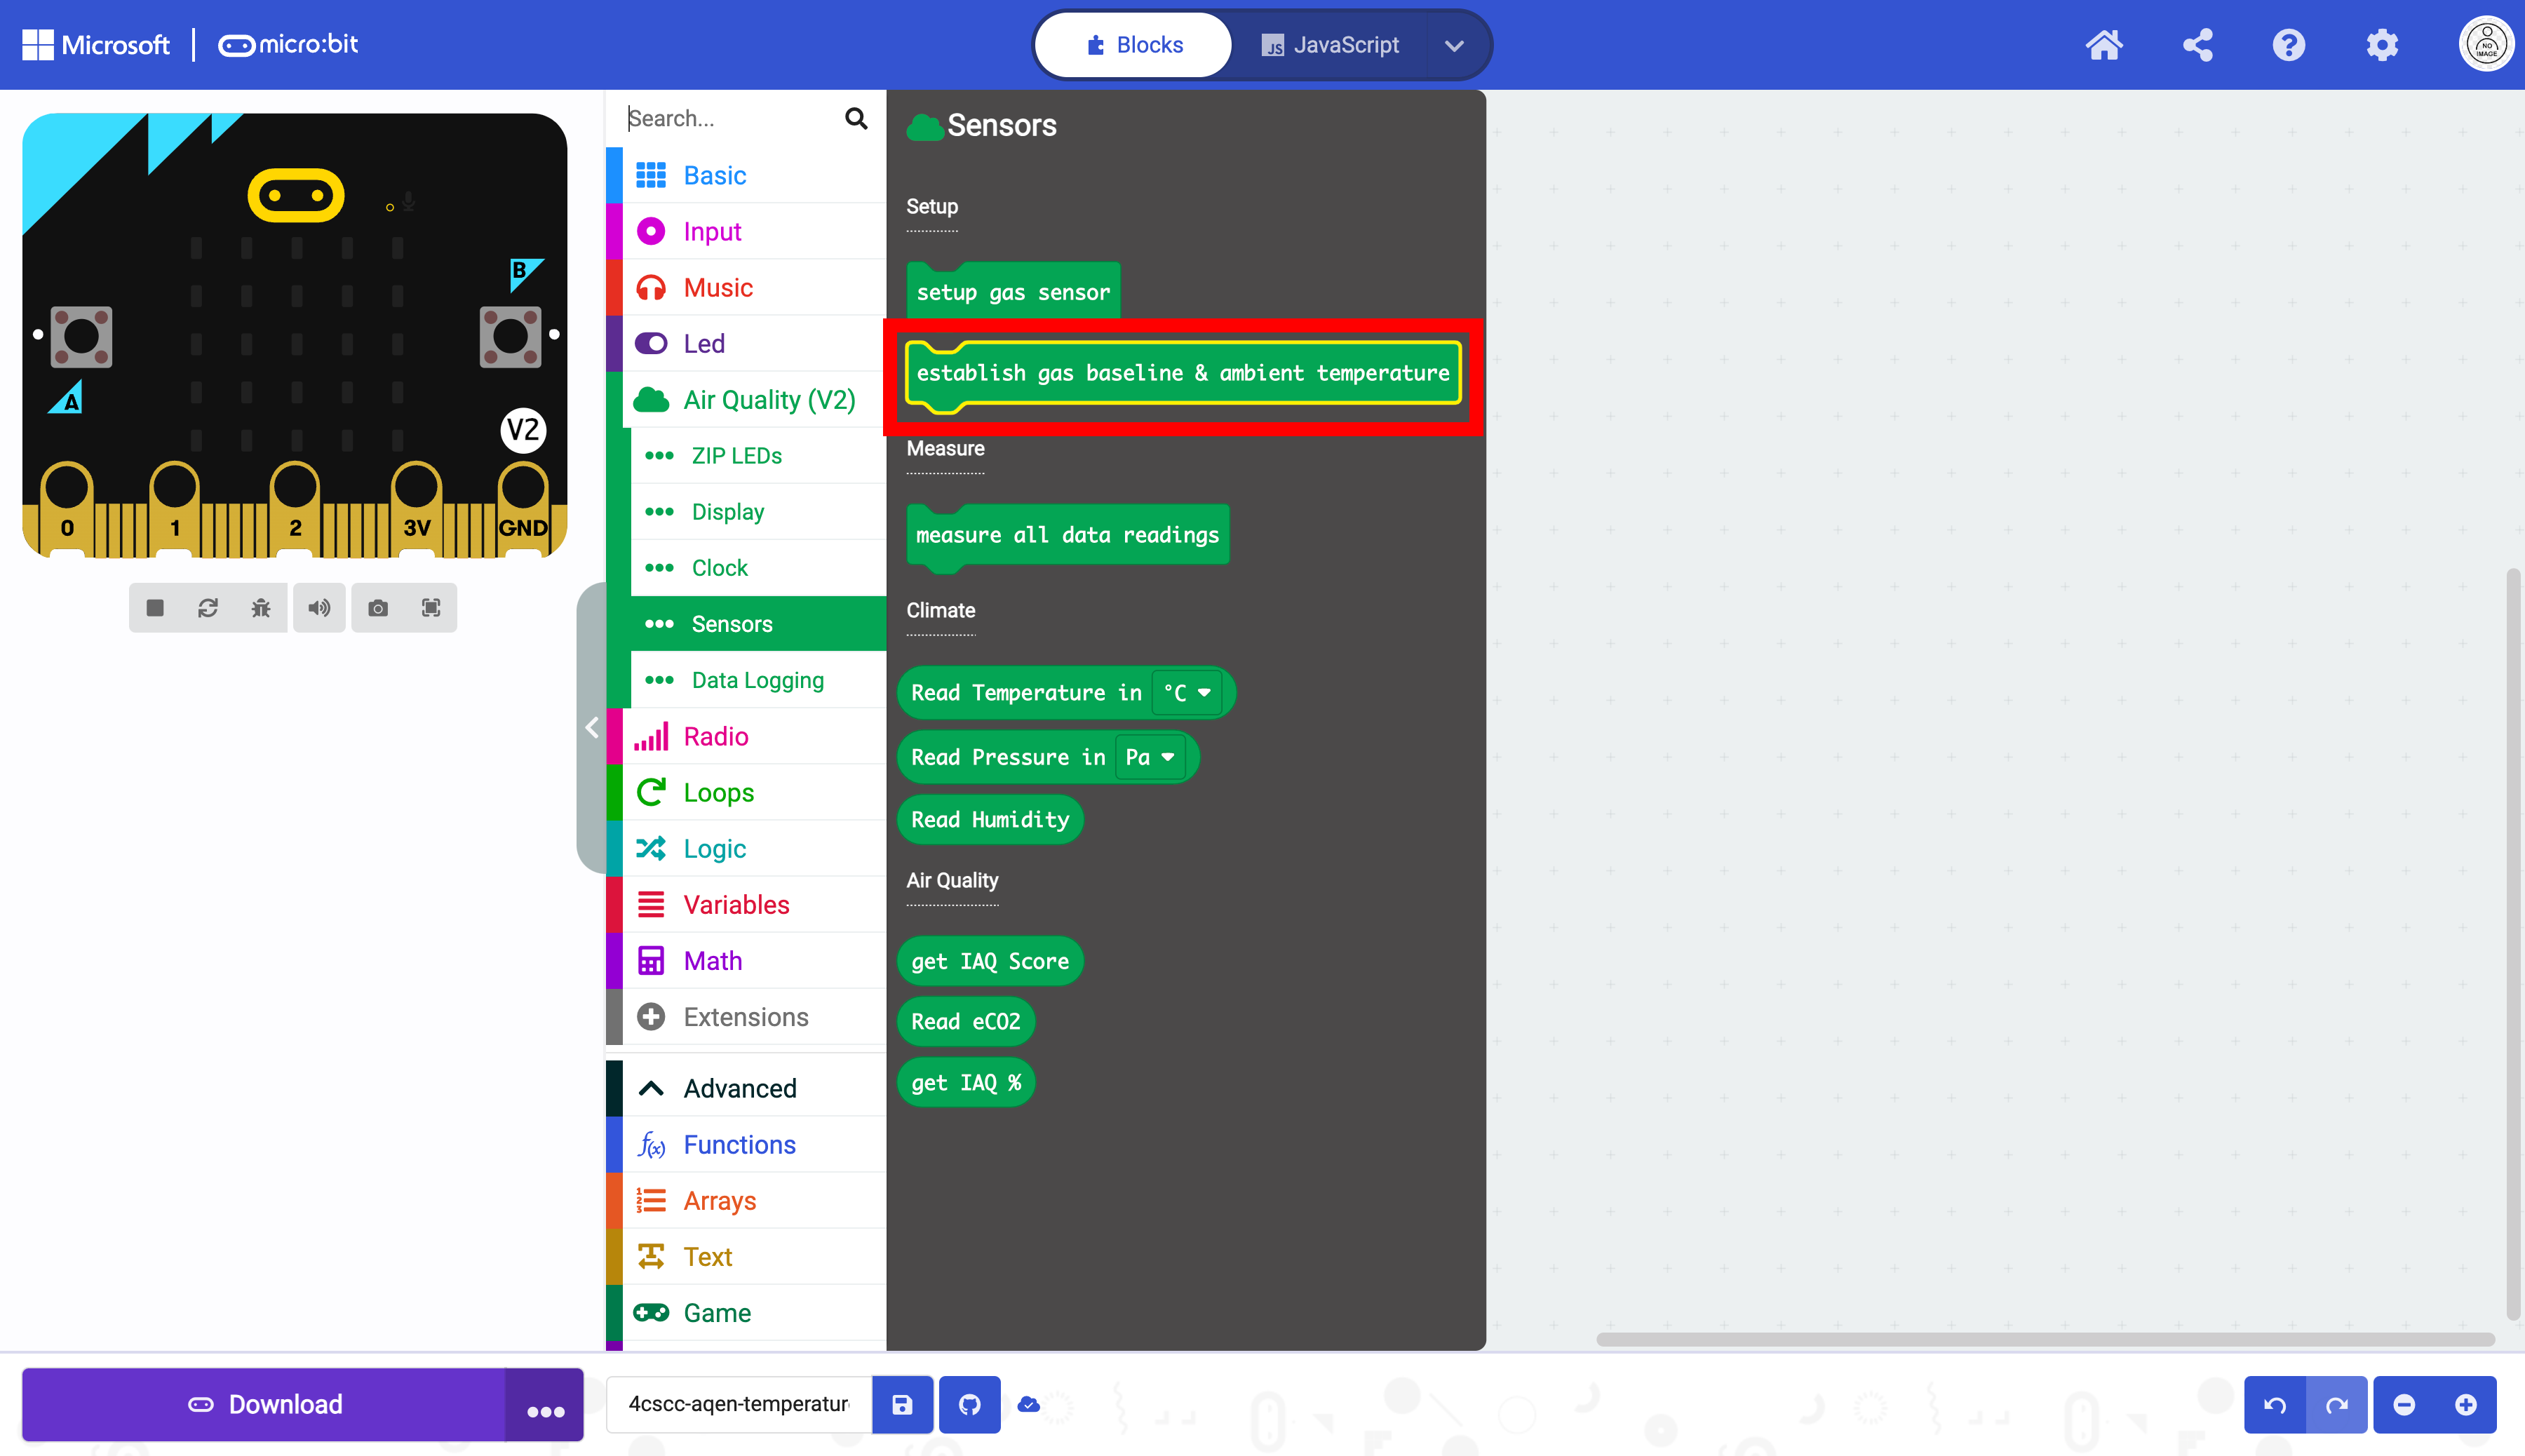
Drag the block into the on start block. This only needs to run once at the beginning of the program.
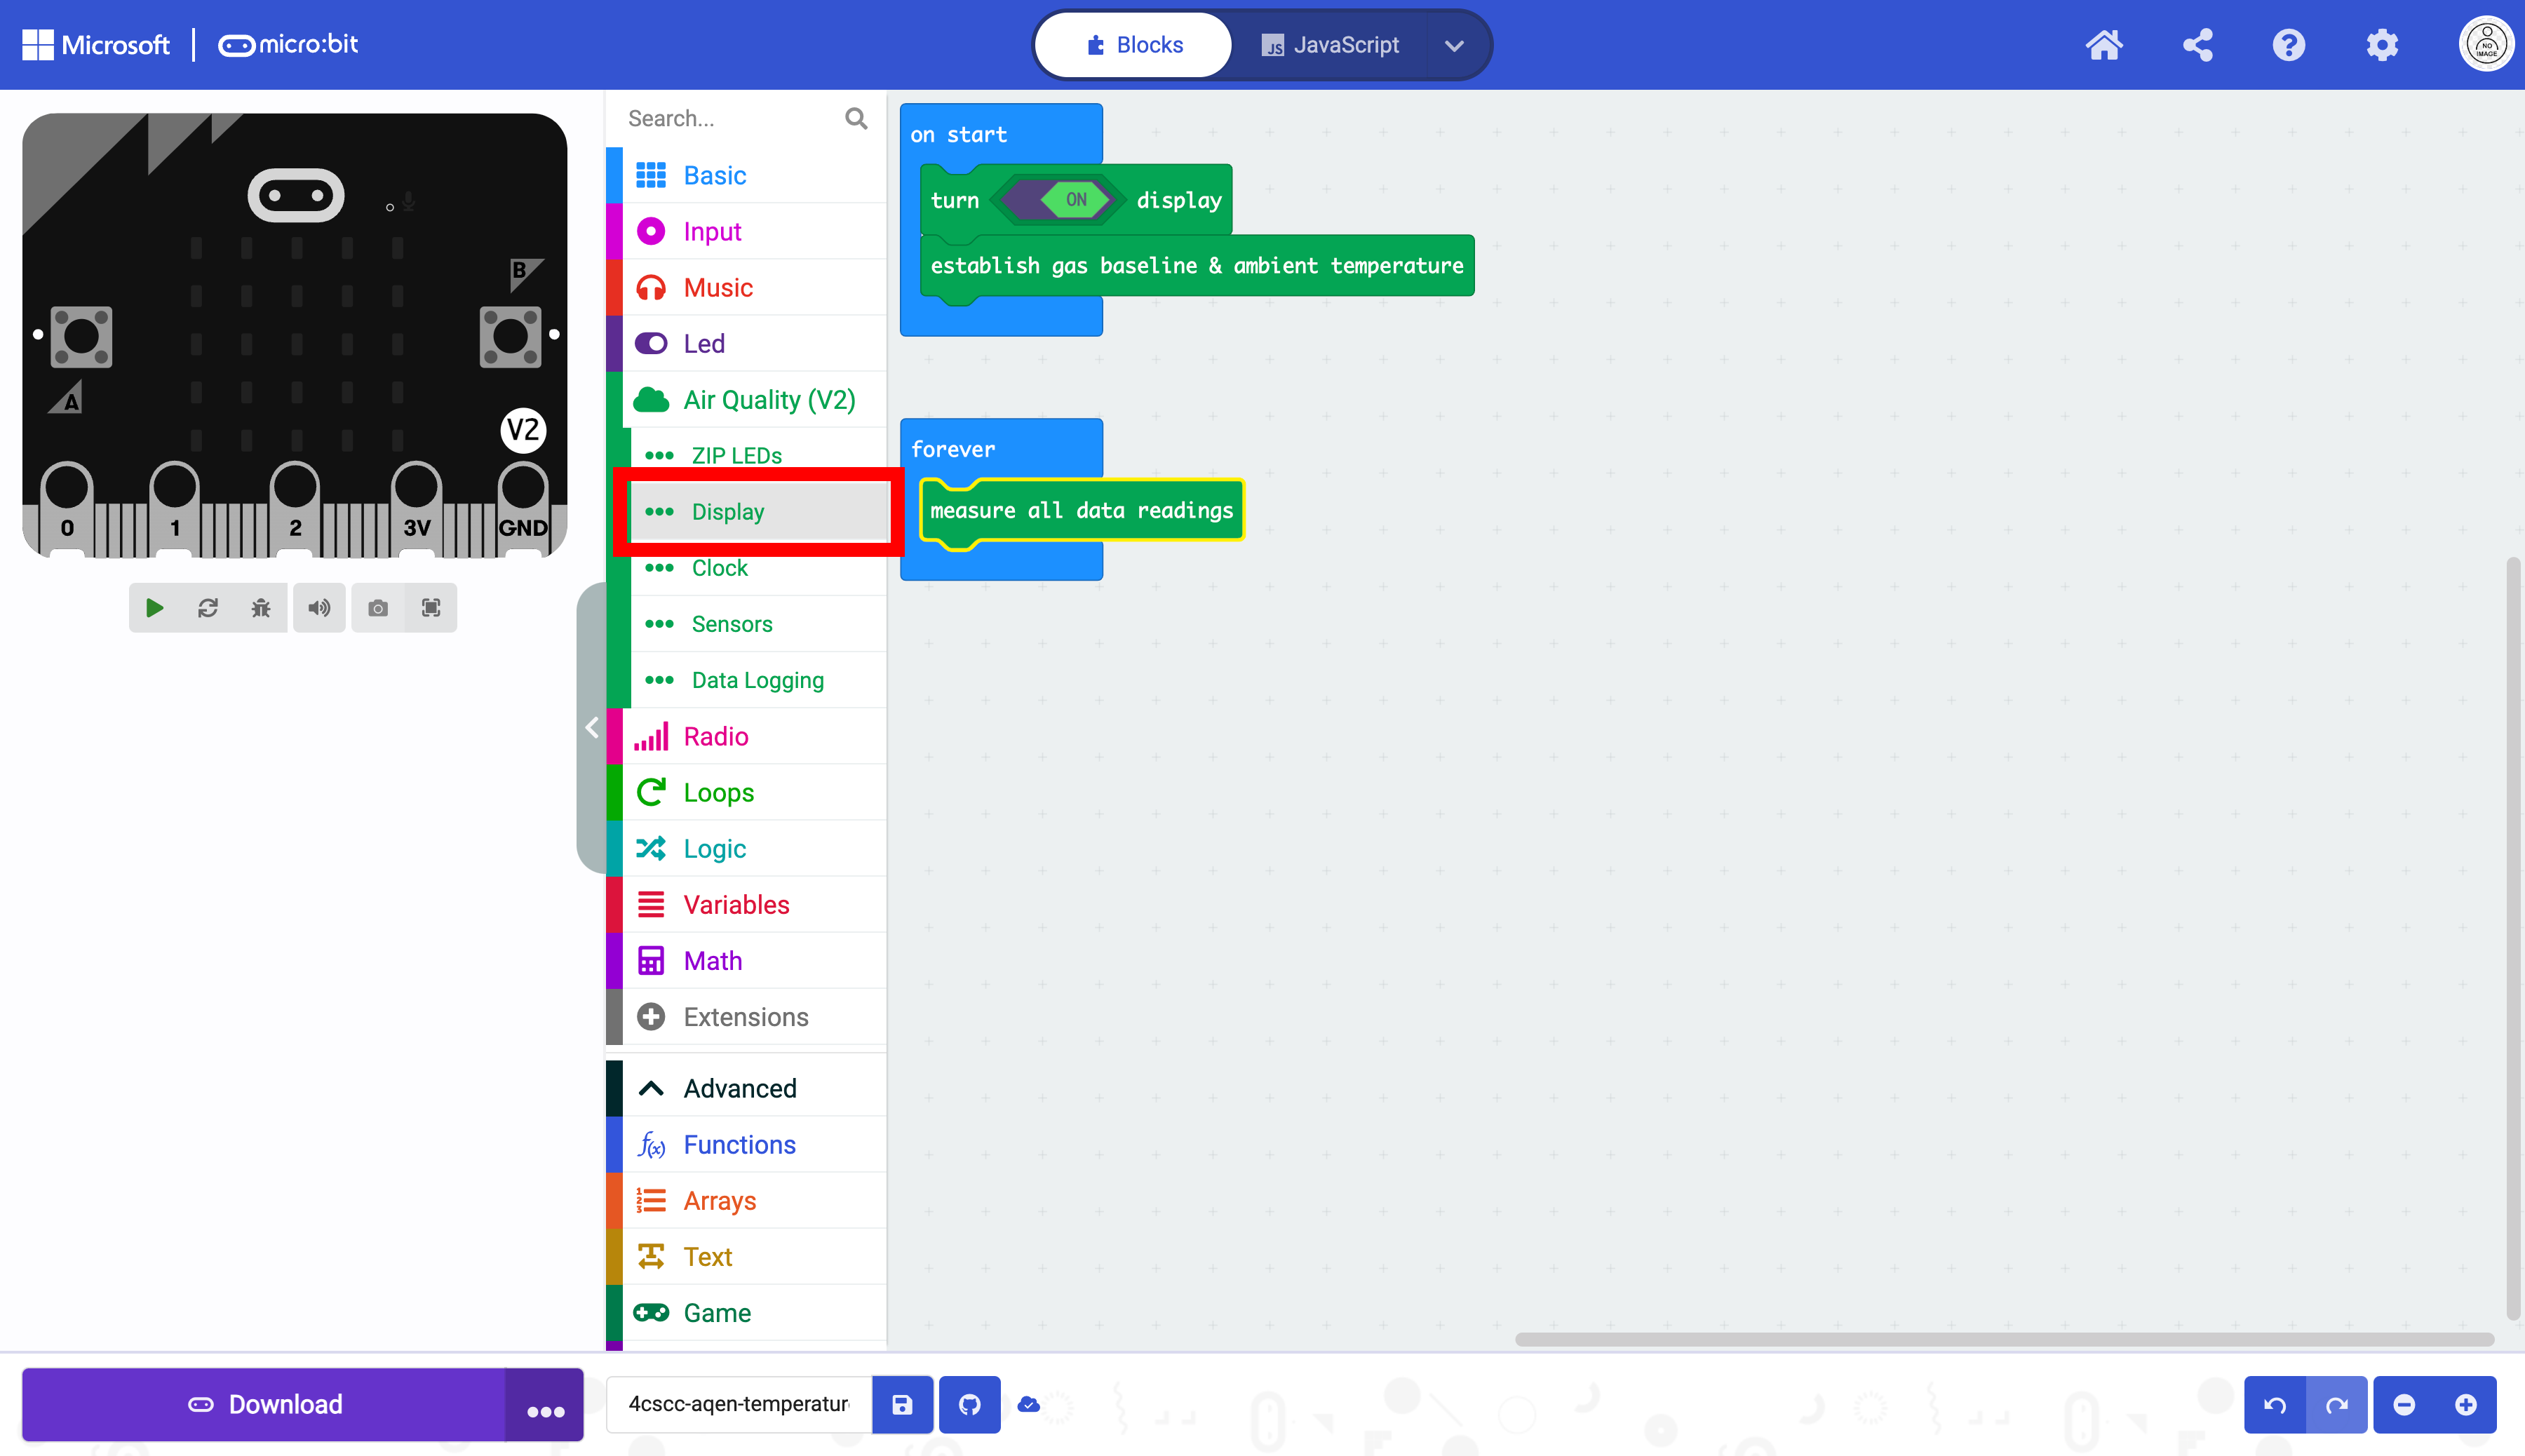
Select the measure all data readings block.
Place the block into the forever block. This will allow the micro:bit to record data in a loop. If this block is placed in the on start block, it will only run once. The data will not be updated continuously.

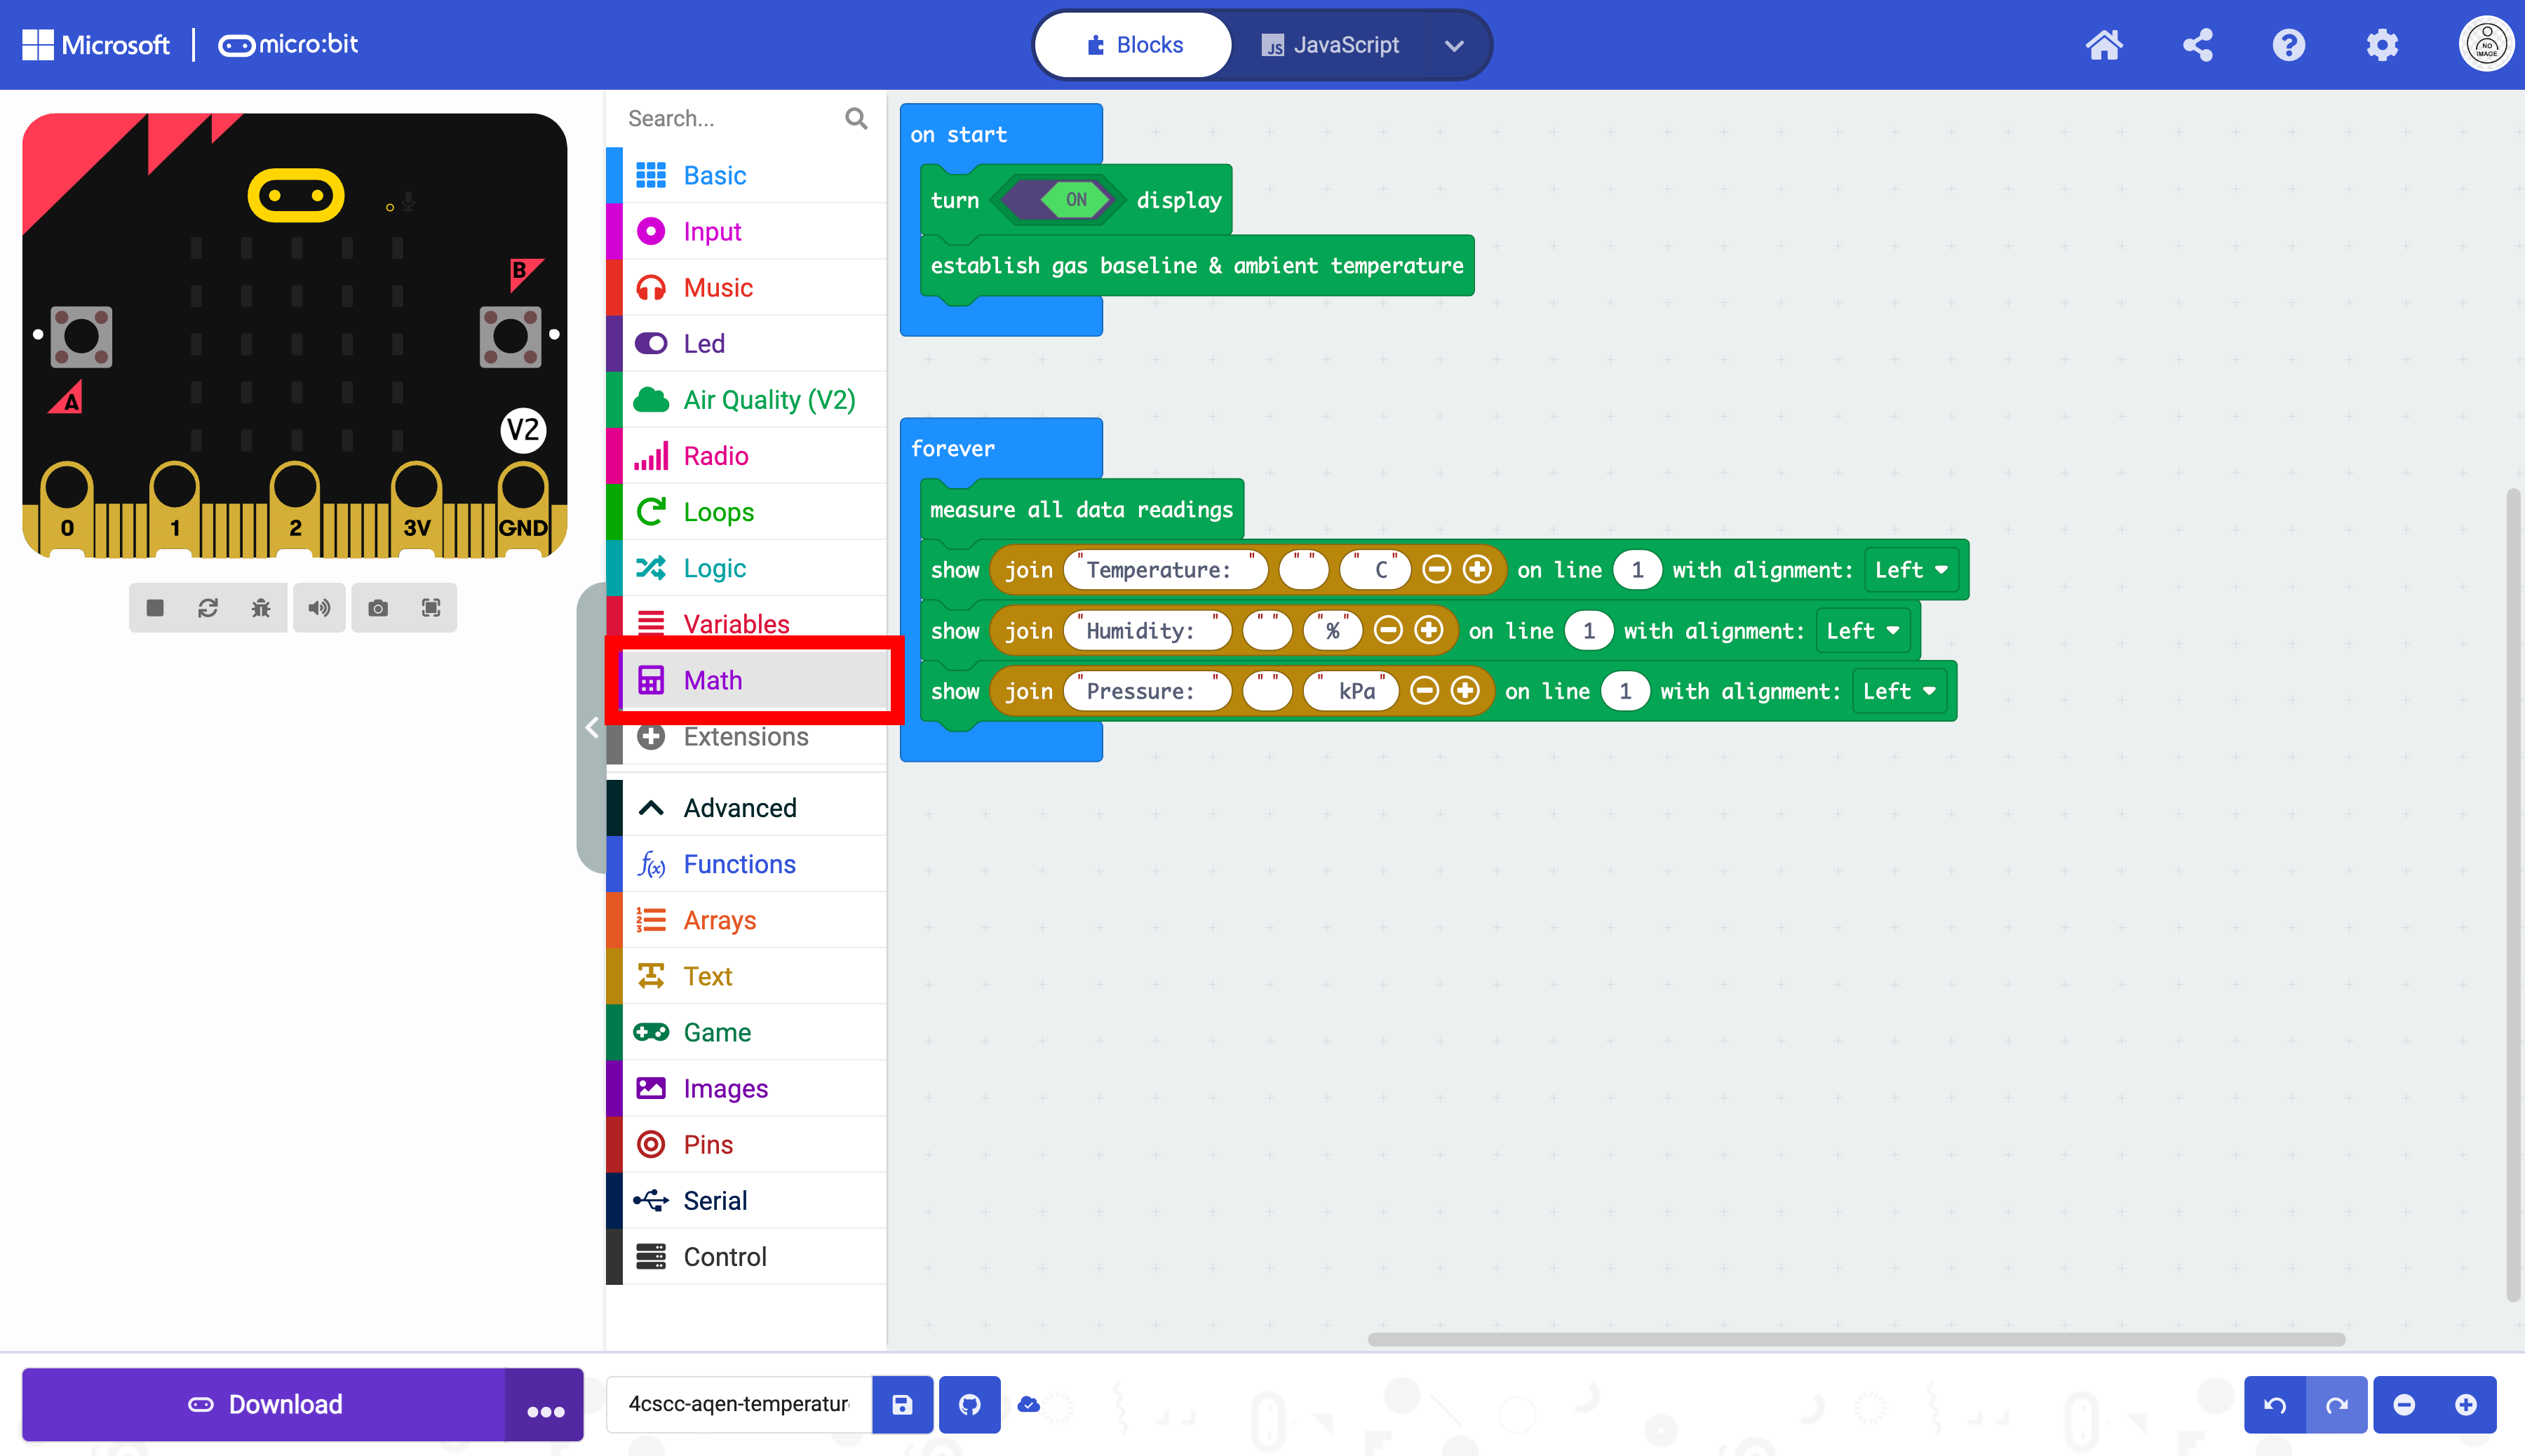
Select the “Display” drawer to access the blocks for the OLED display.
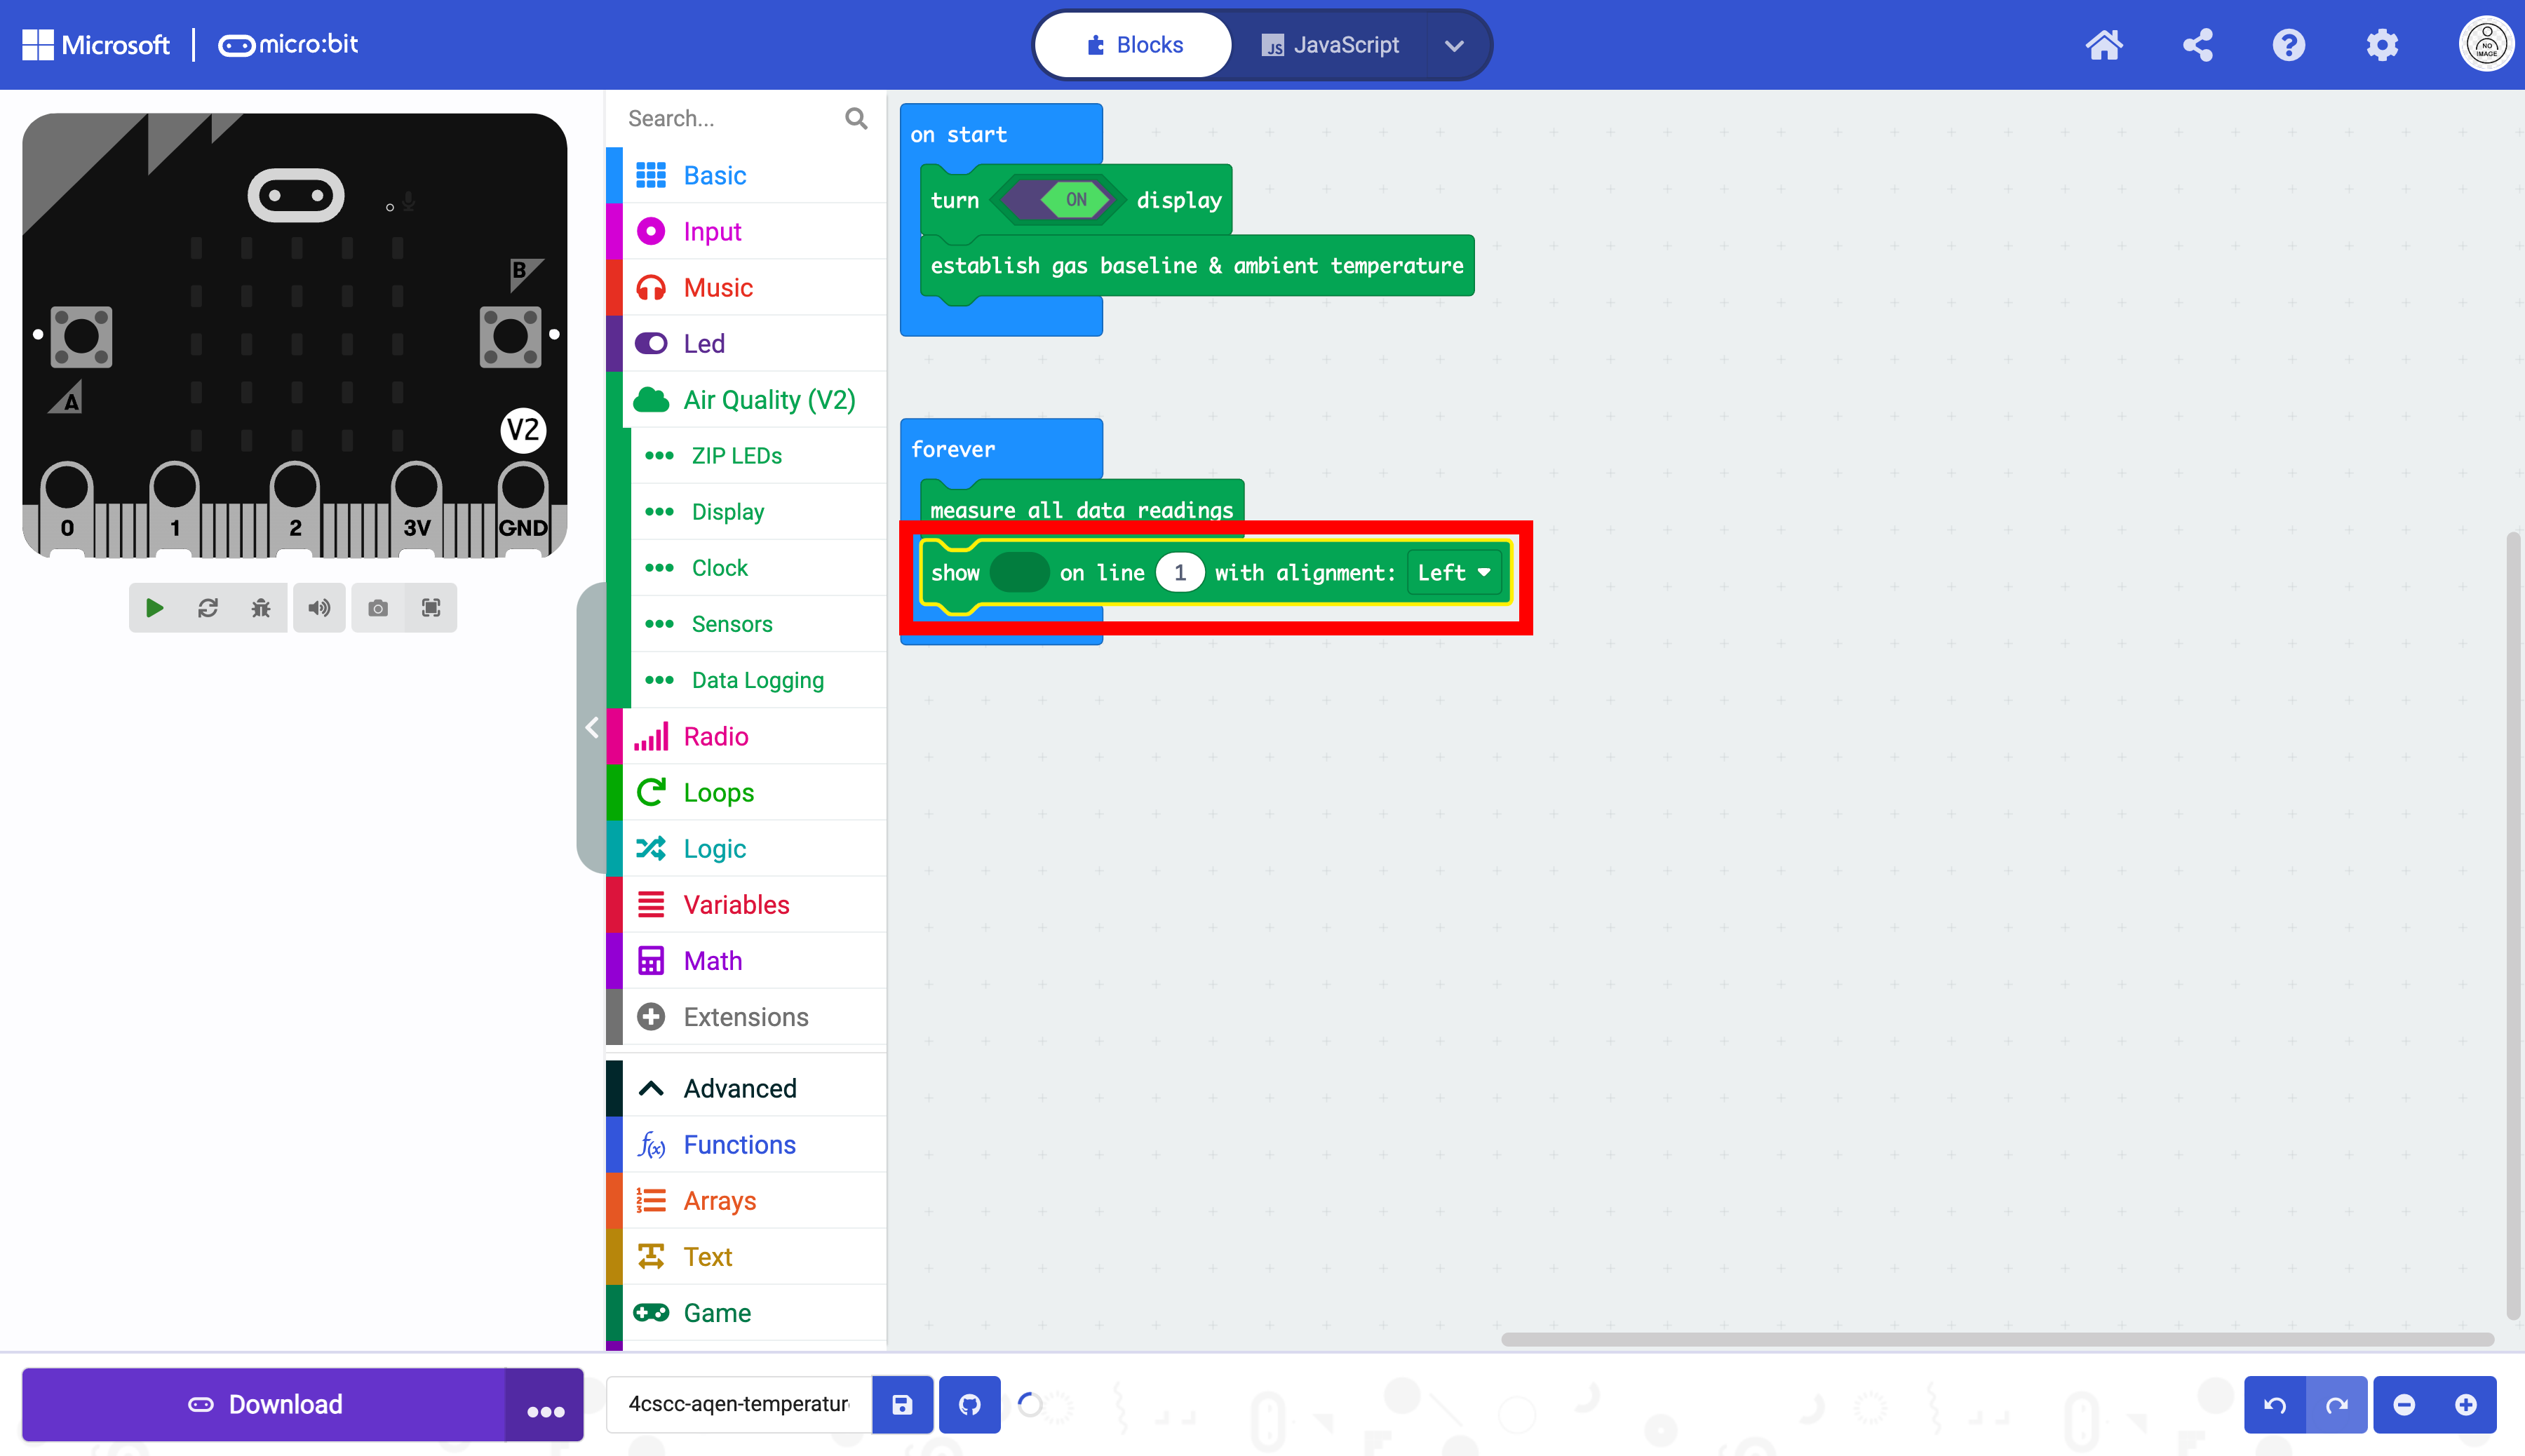
Select the block that displays text on the OLED screen.
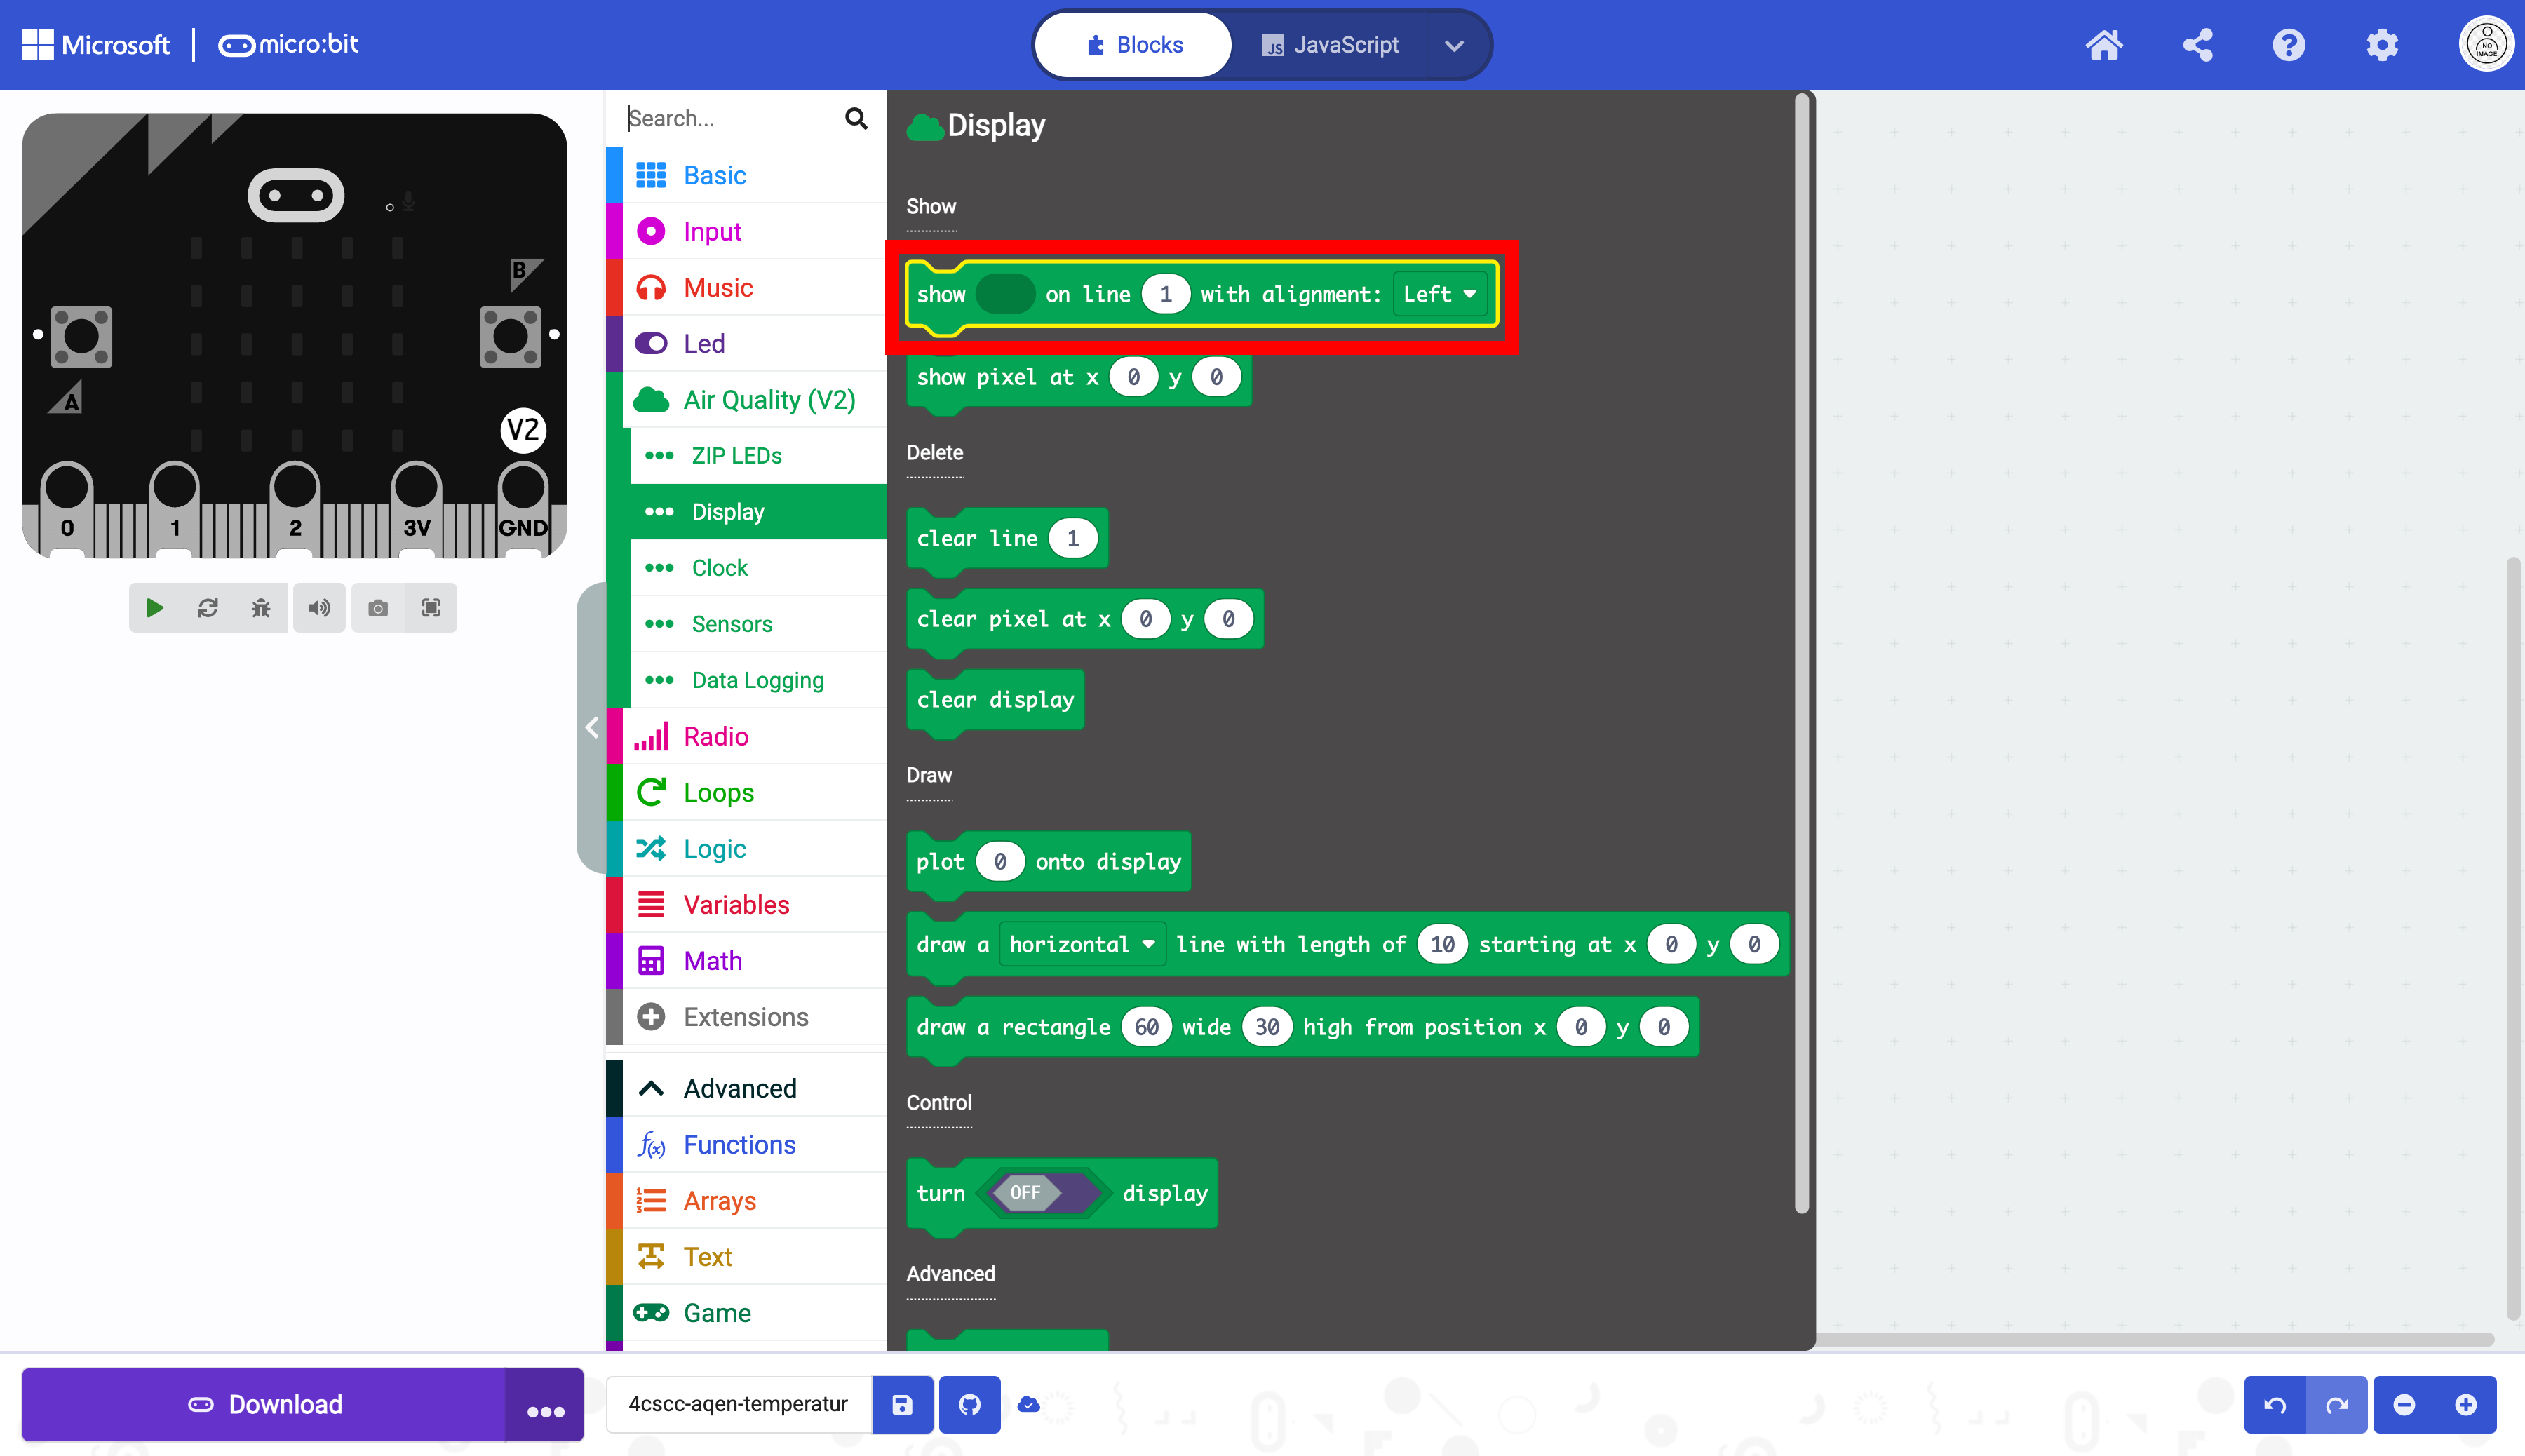
Drag the block into the forever loop below the other block.
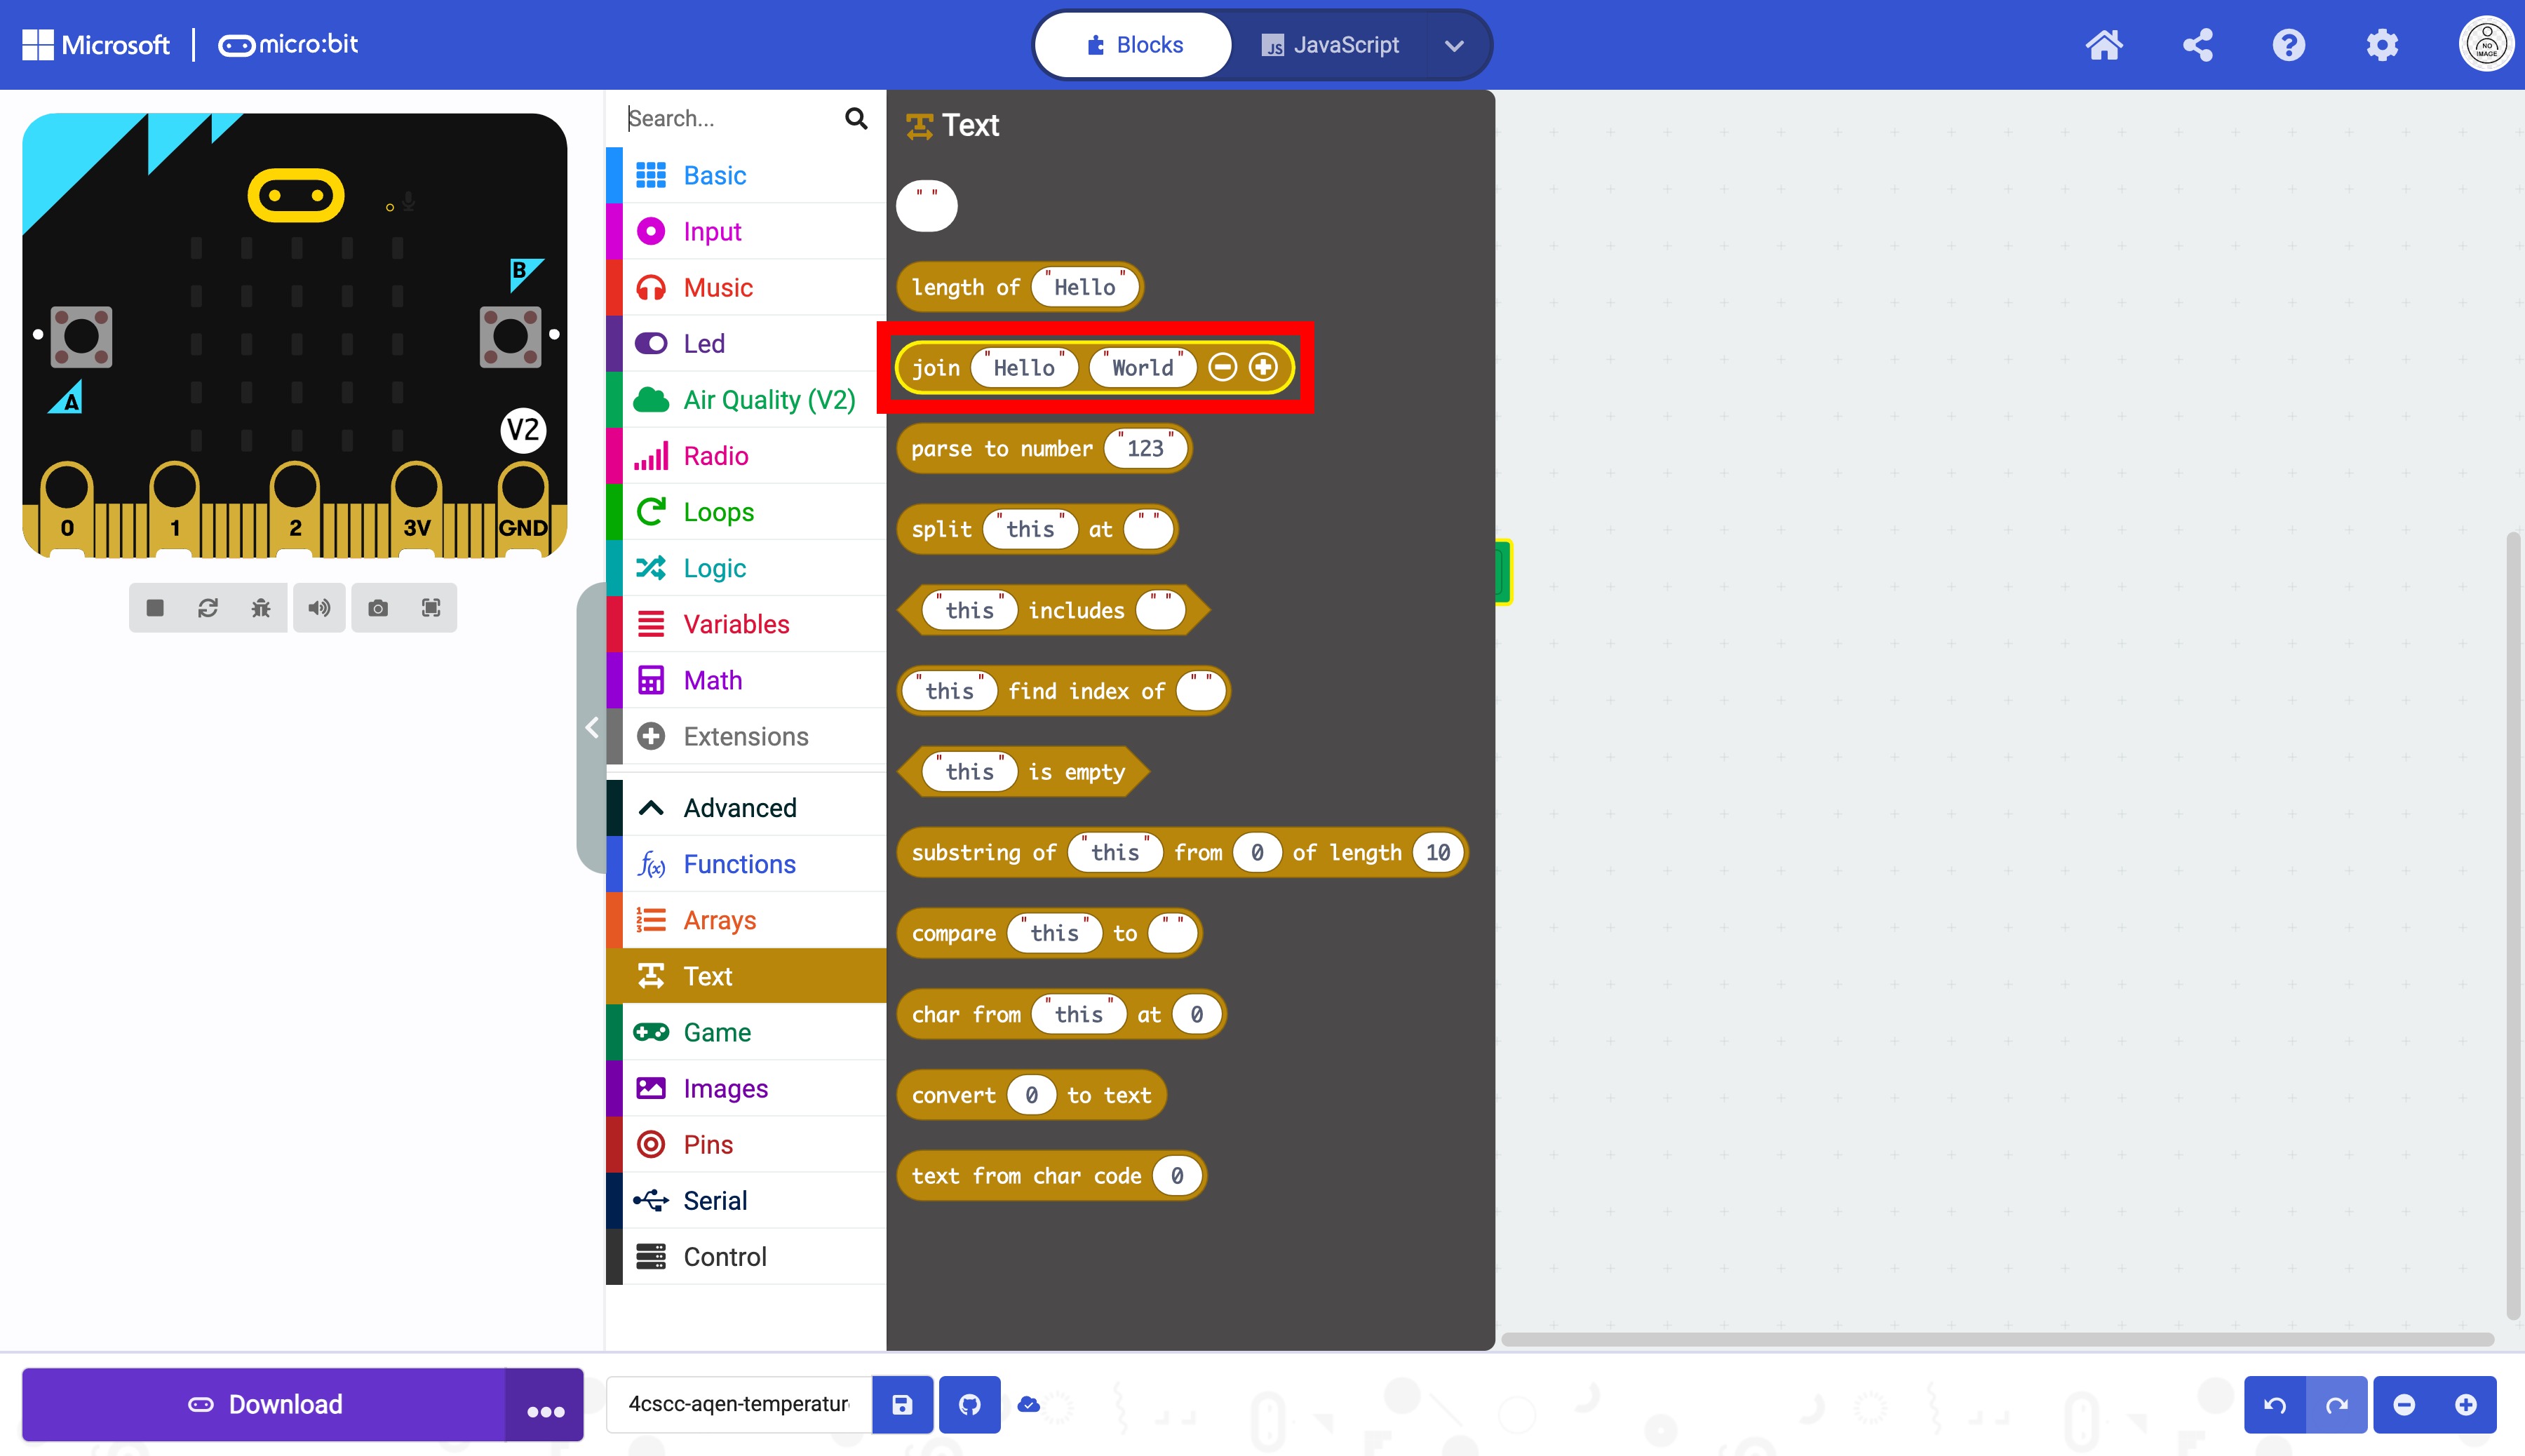
Select the “Text” drawer in “Advanced” drawer in the Toolbox.

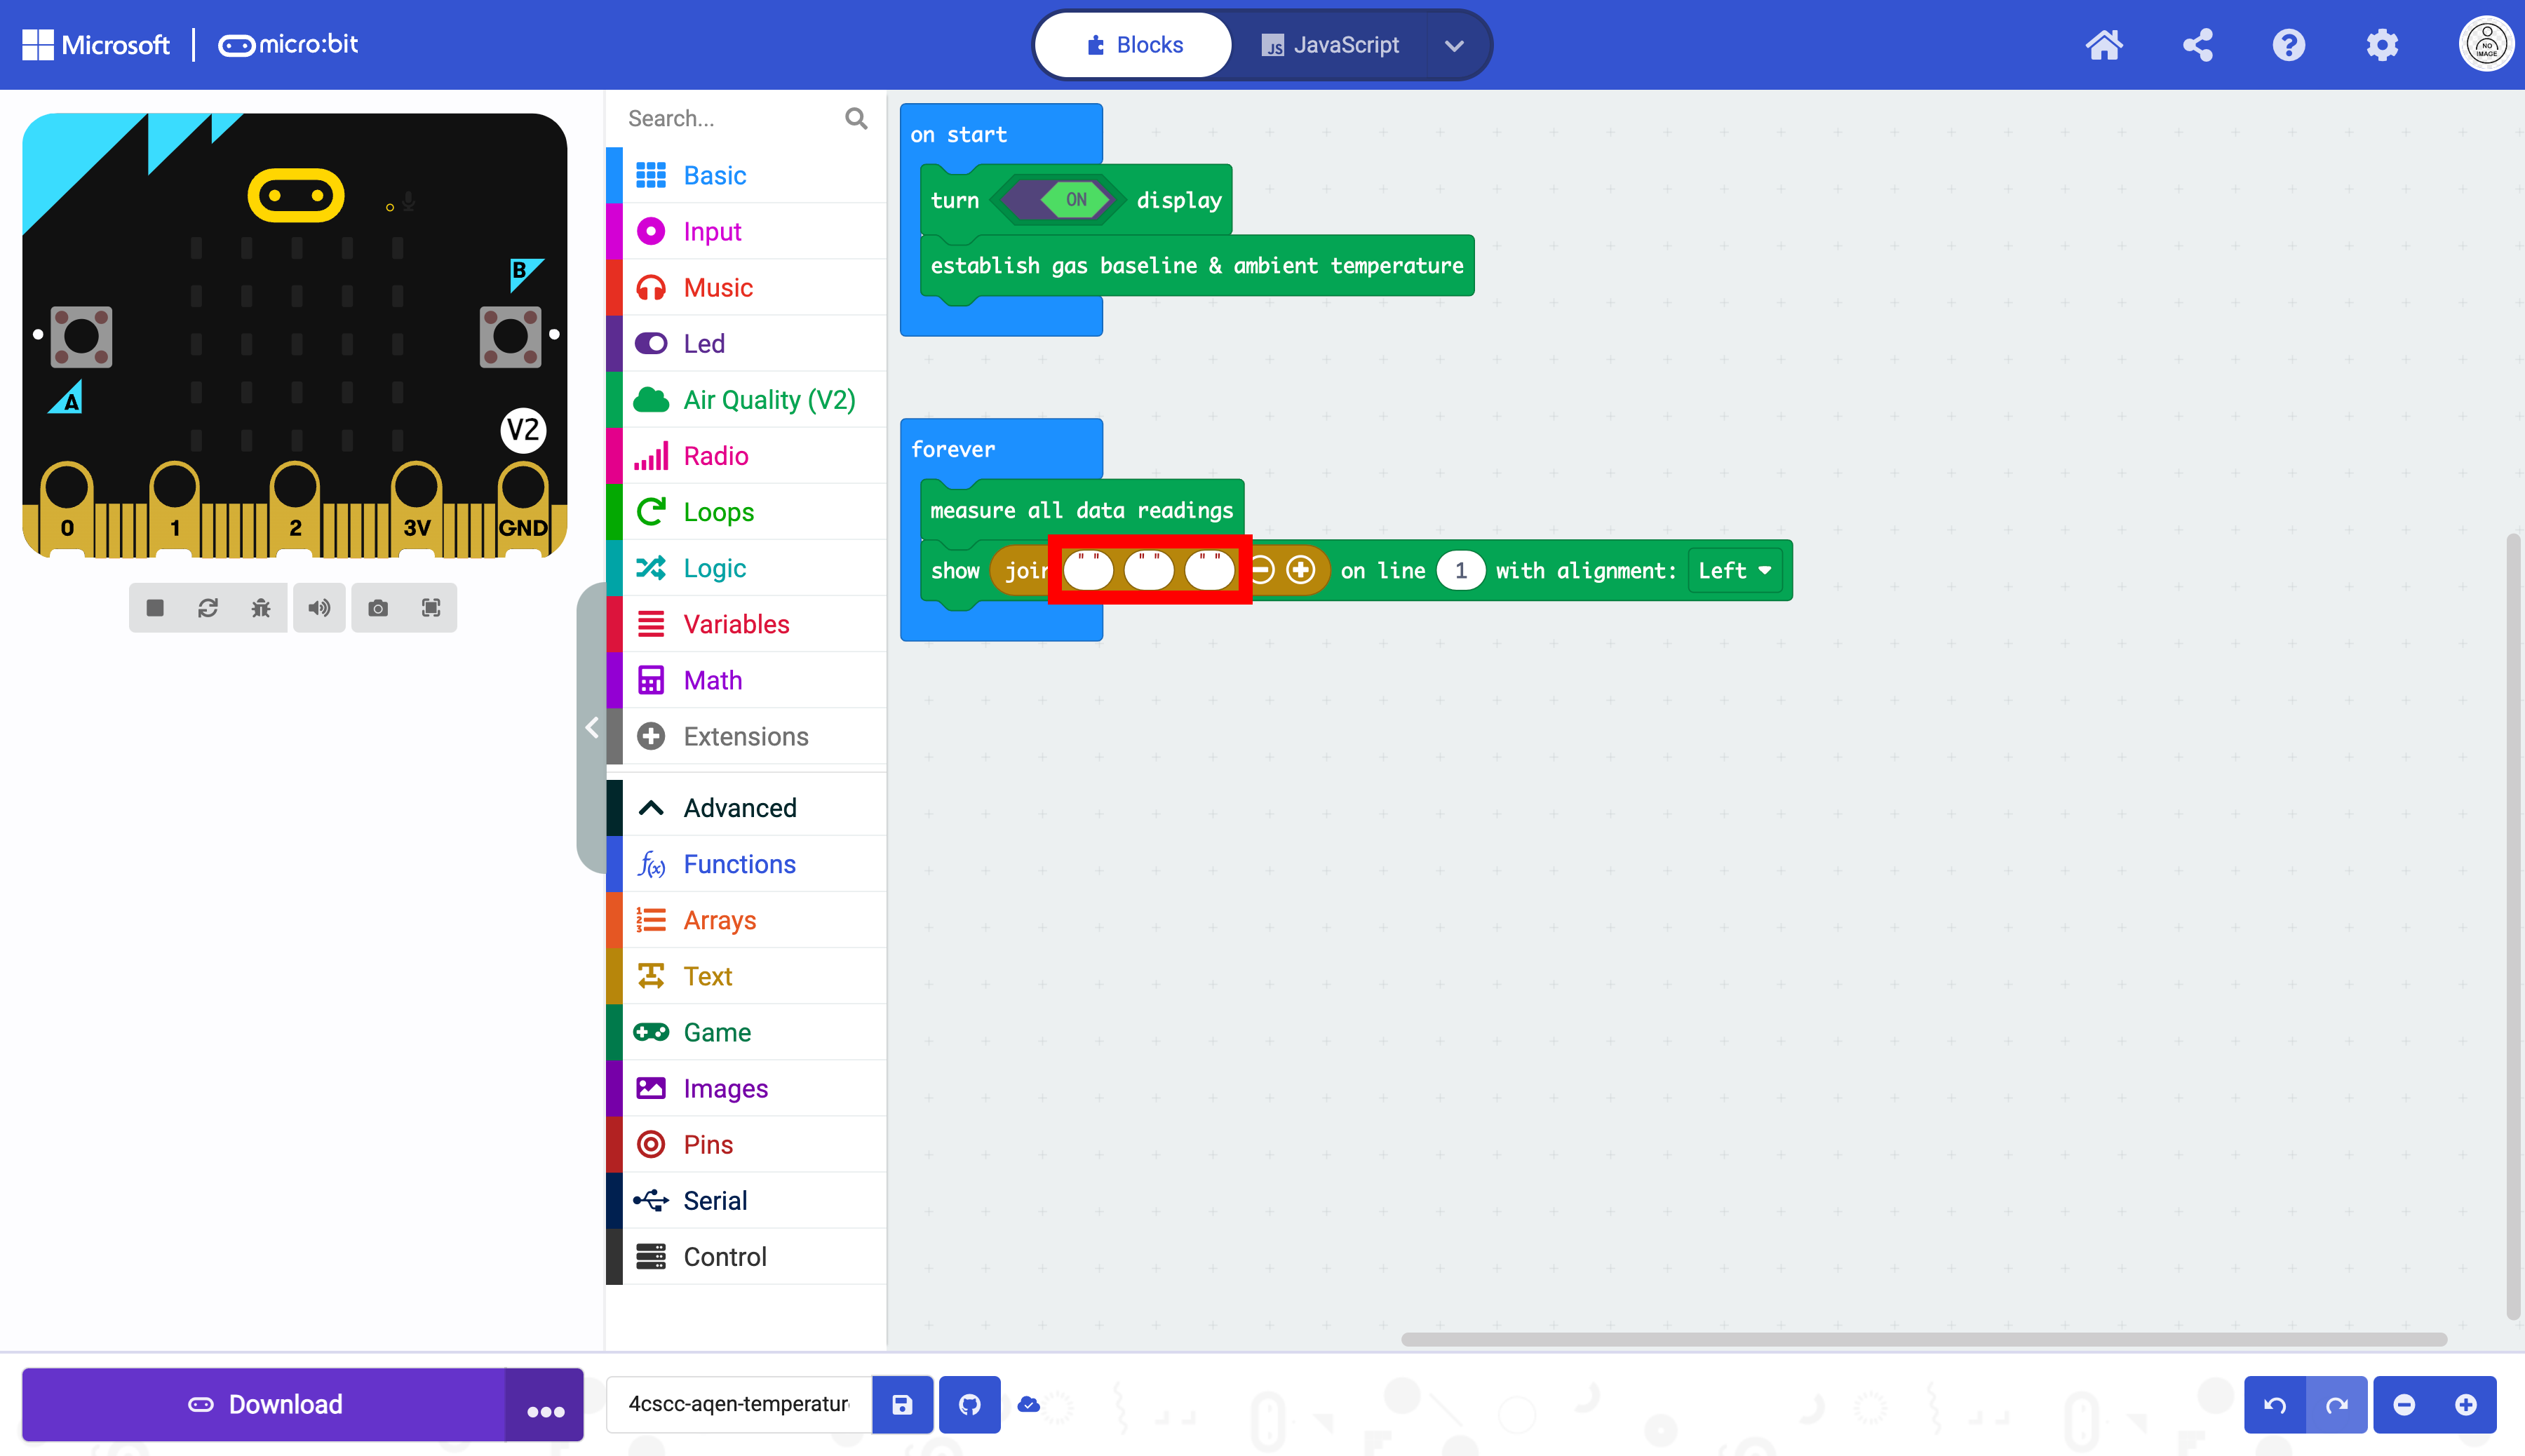
Select the join block. This block combines two strings represented by the two ovals containing the worlds “Hello” and “World”. You can add or remove strings by using the -/+ buttons to the right. This block is necessary only if you combine two different strings from distinct sources, such as a sensor value or a variable.
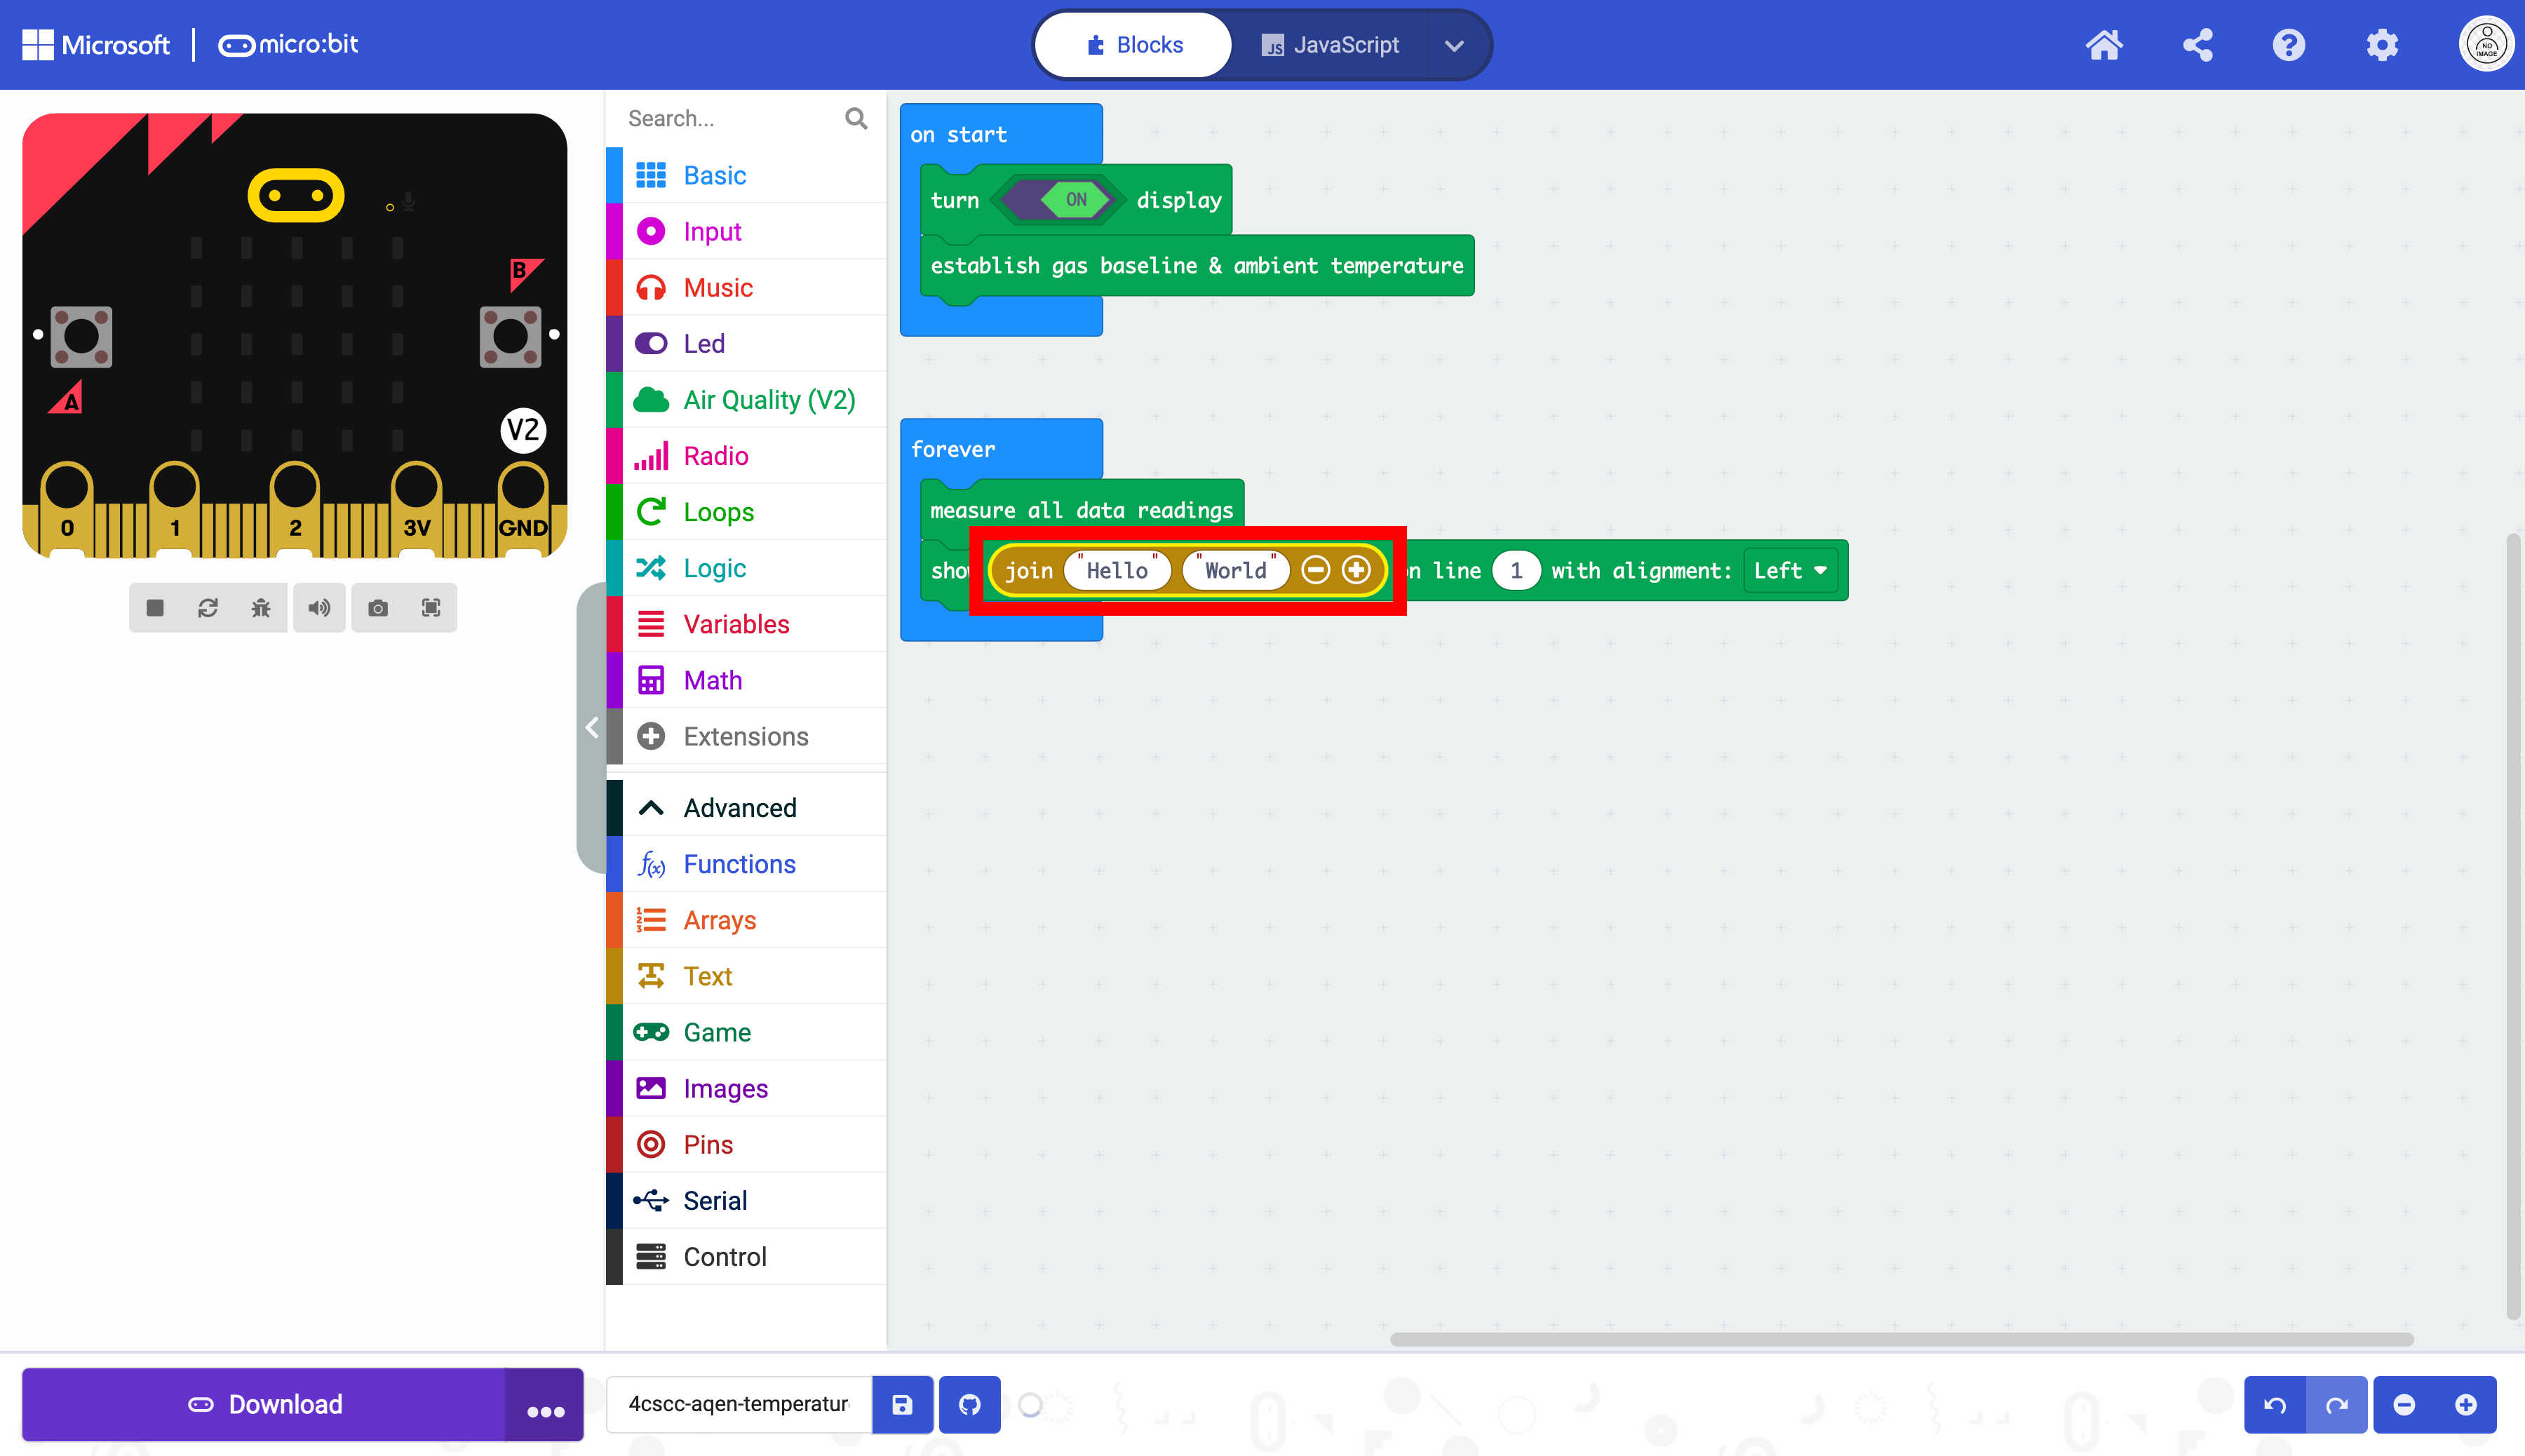
Place the block in the first oval the show block.
The data the micro:bit we will be reading is temperature data in celsius, relative humidity and atmospheric pressure. Temperature data is often displayed with the C at the end to indicate that the reading is in Celsius. Relative humidity is a percentage and is often followed by a %. Atmospheric pressure is often measured in Kilopascals (kPa).
The data will need to be represented as three separate strings.
String 1 |
String 2 |
String 3 |
|---|---|---|
|
|
|
|
|
|
|
|
|
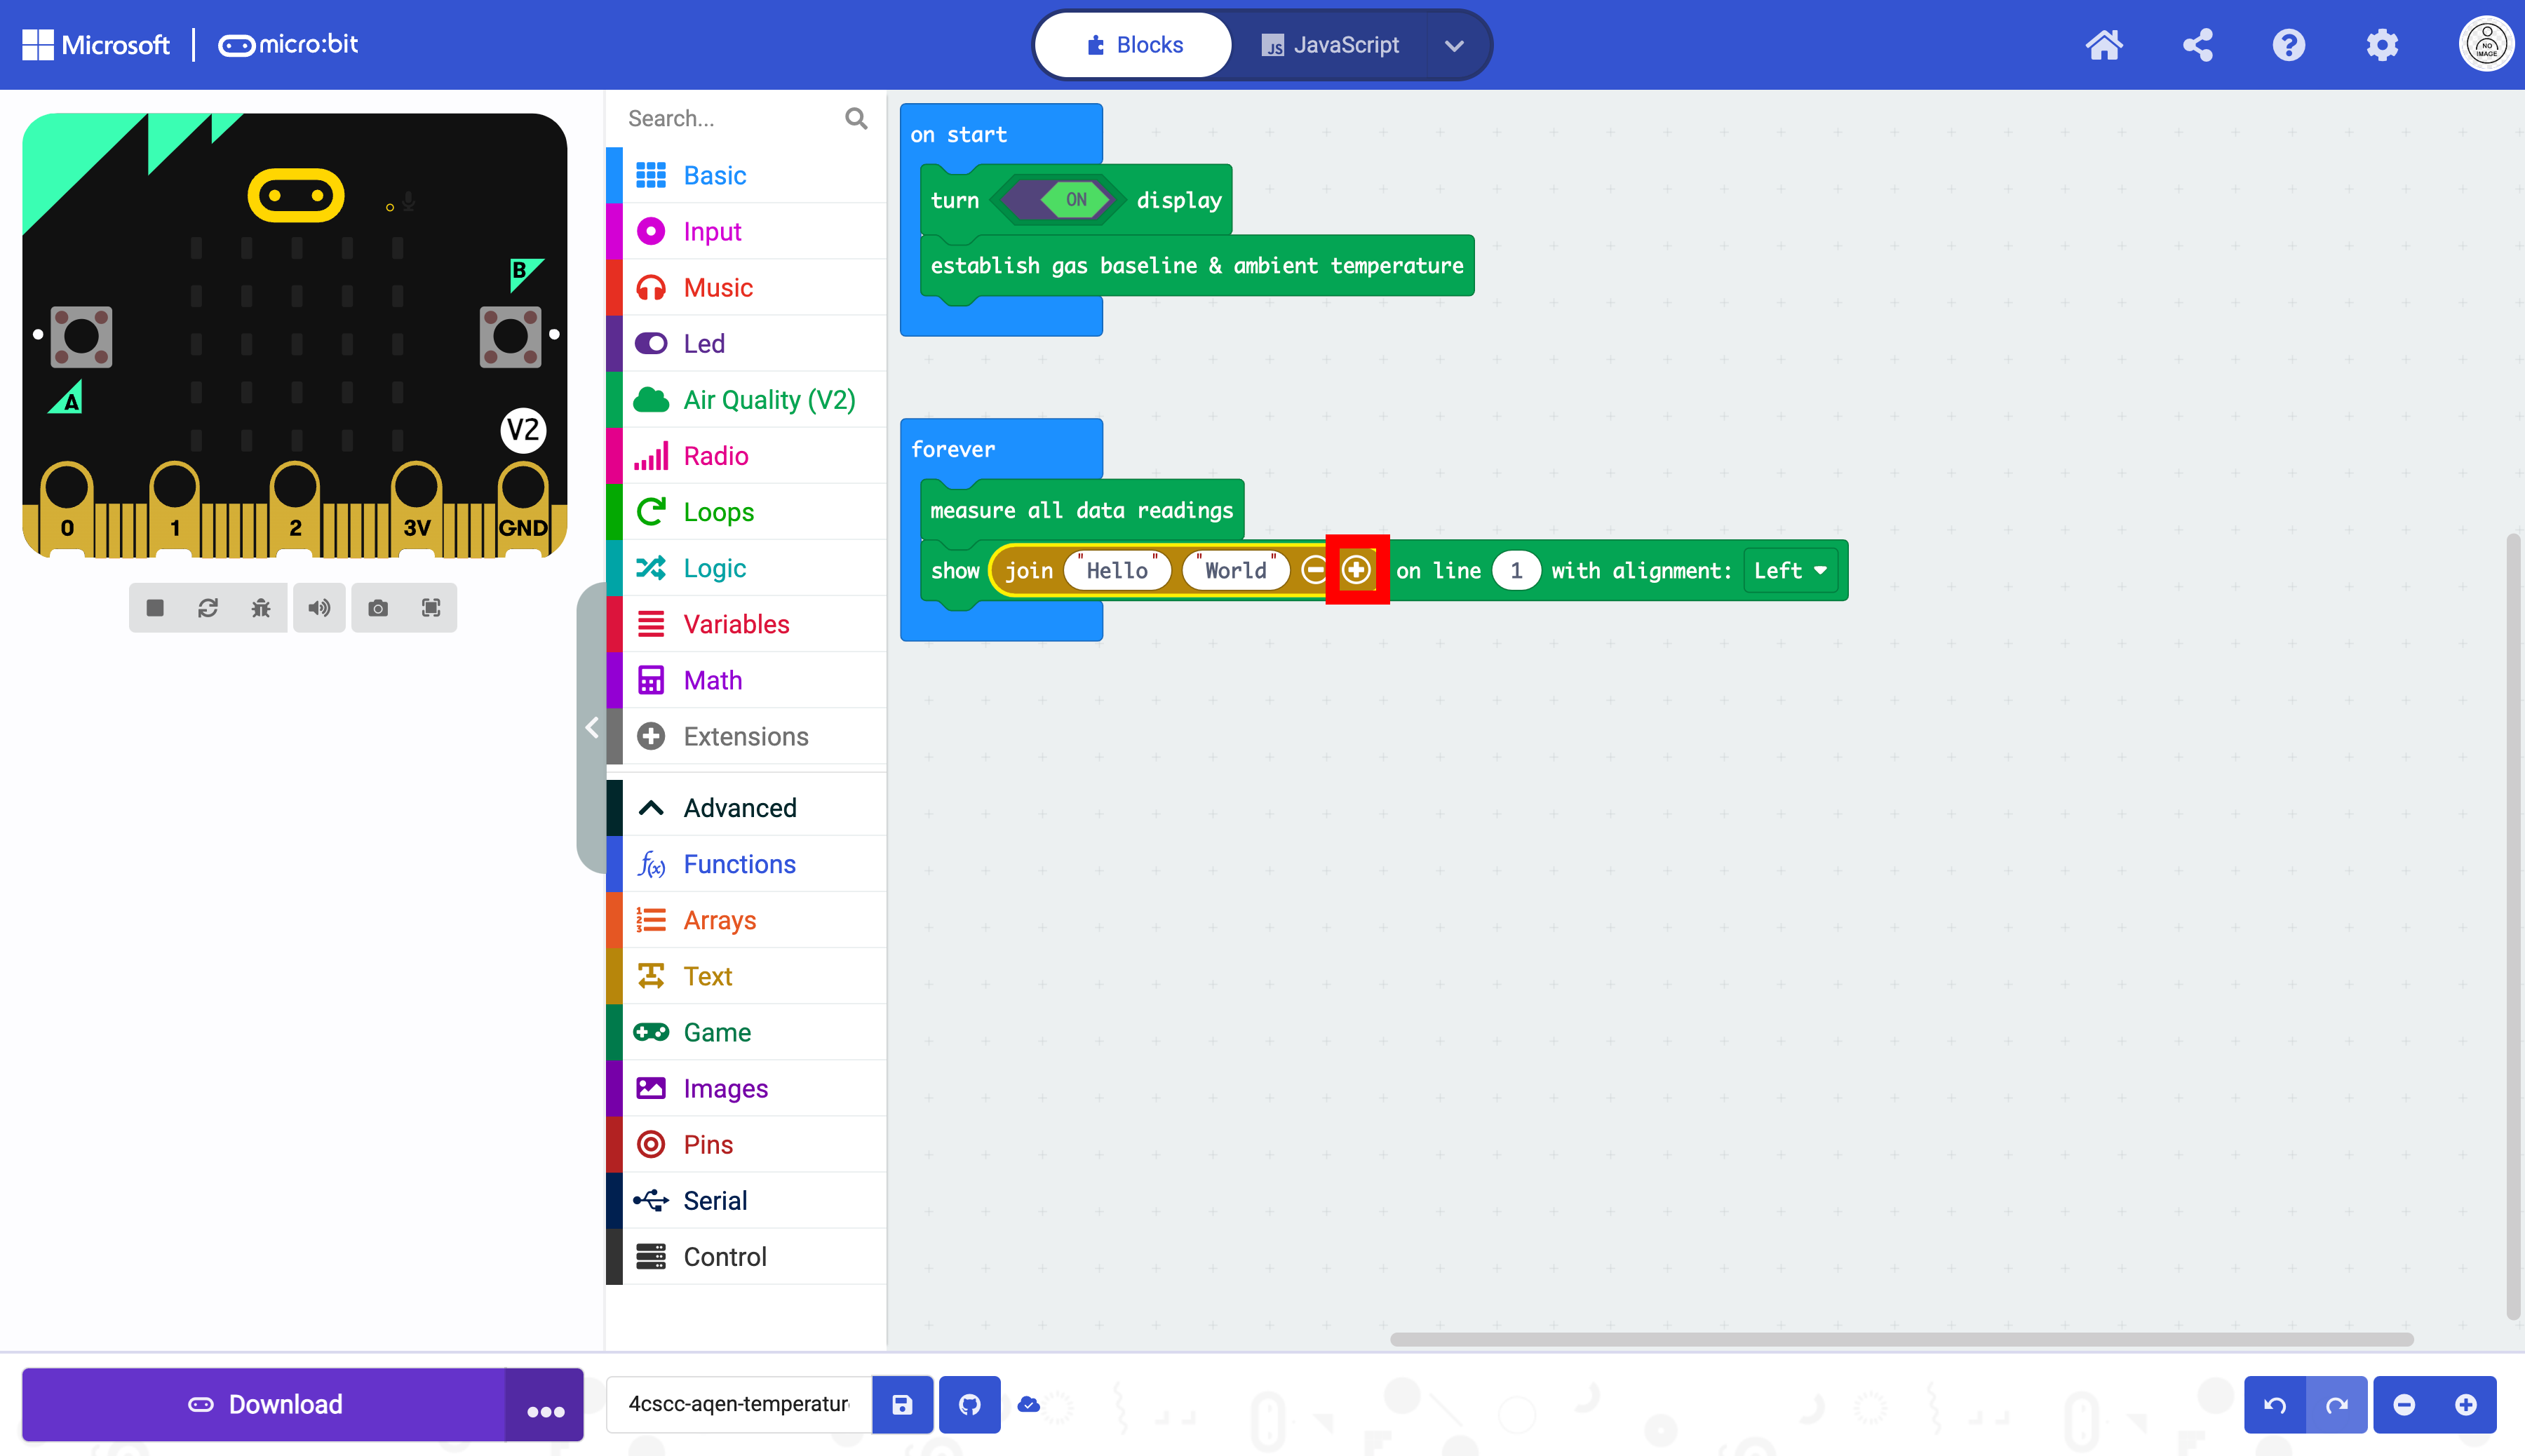
This will require a third string. Add another string box with the + button.
Clear the text in all three ovals to create empty strings.
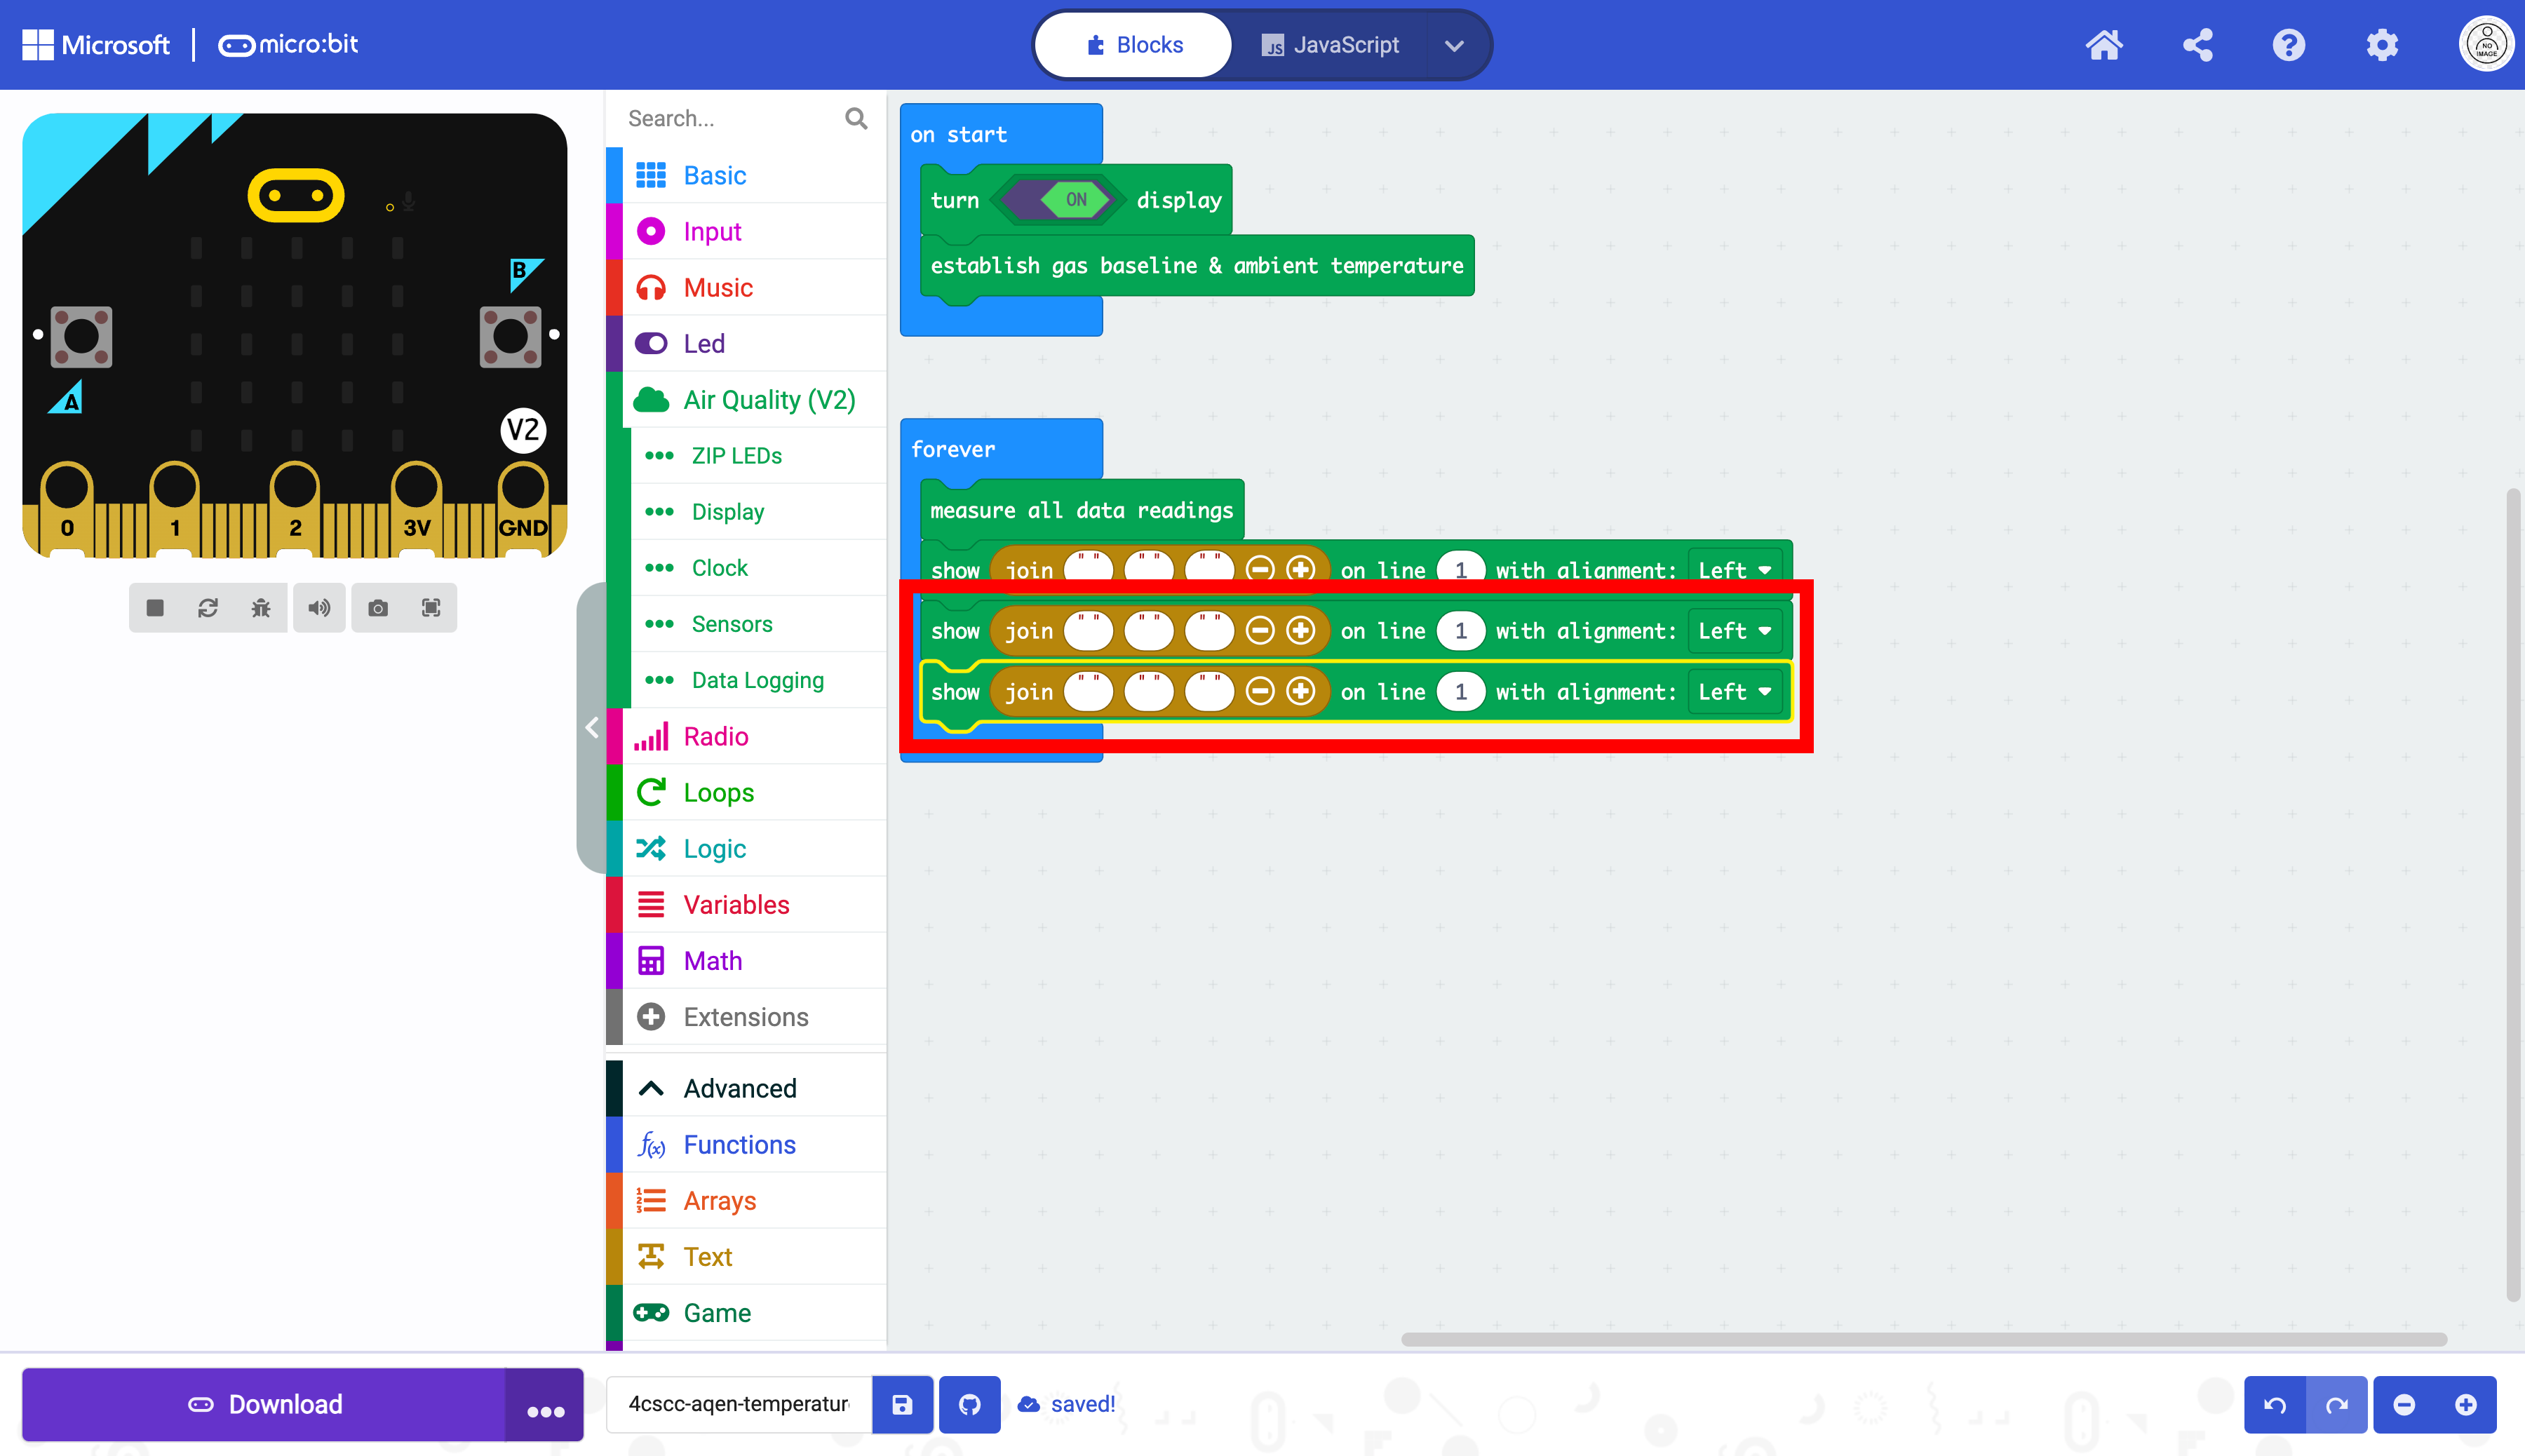
Duplicate the box that displays text twice.

Select the two duplicated blocks.
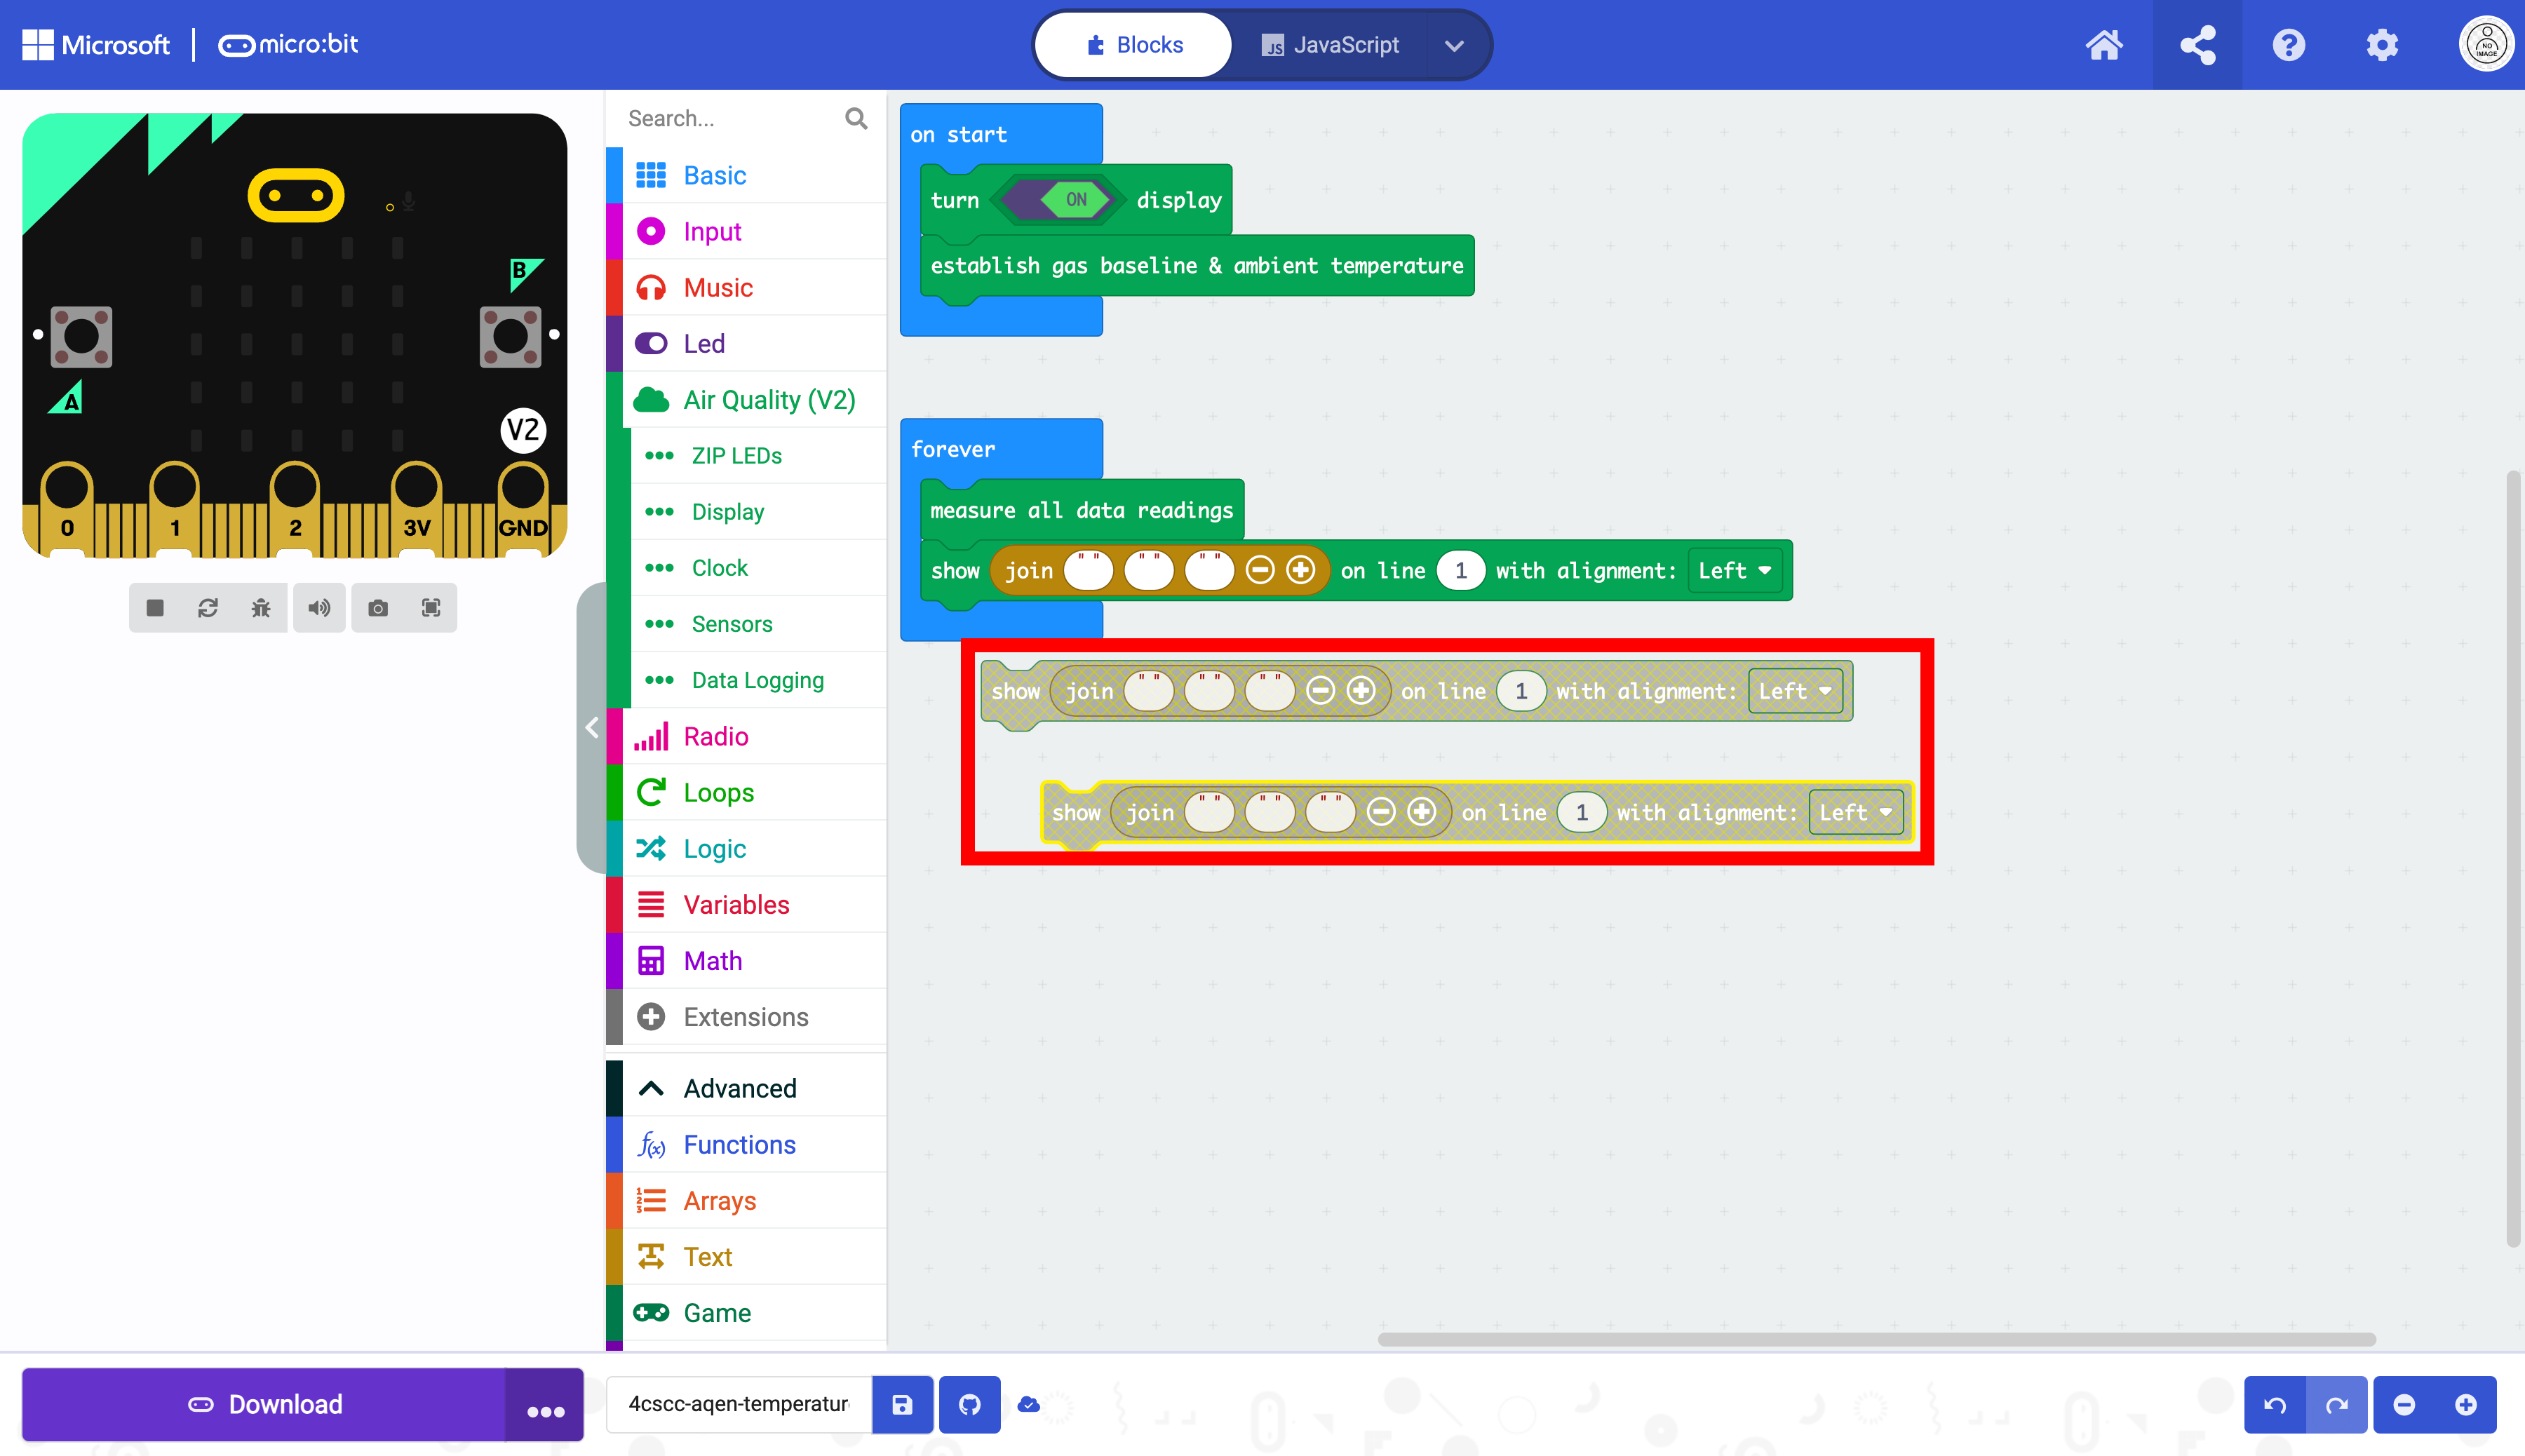
Place the blocks in the forever block below the other block as displayed below:
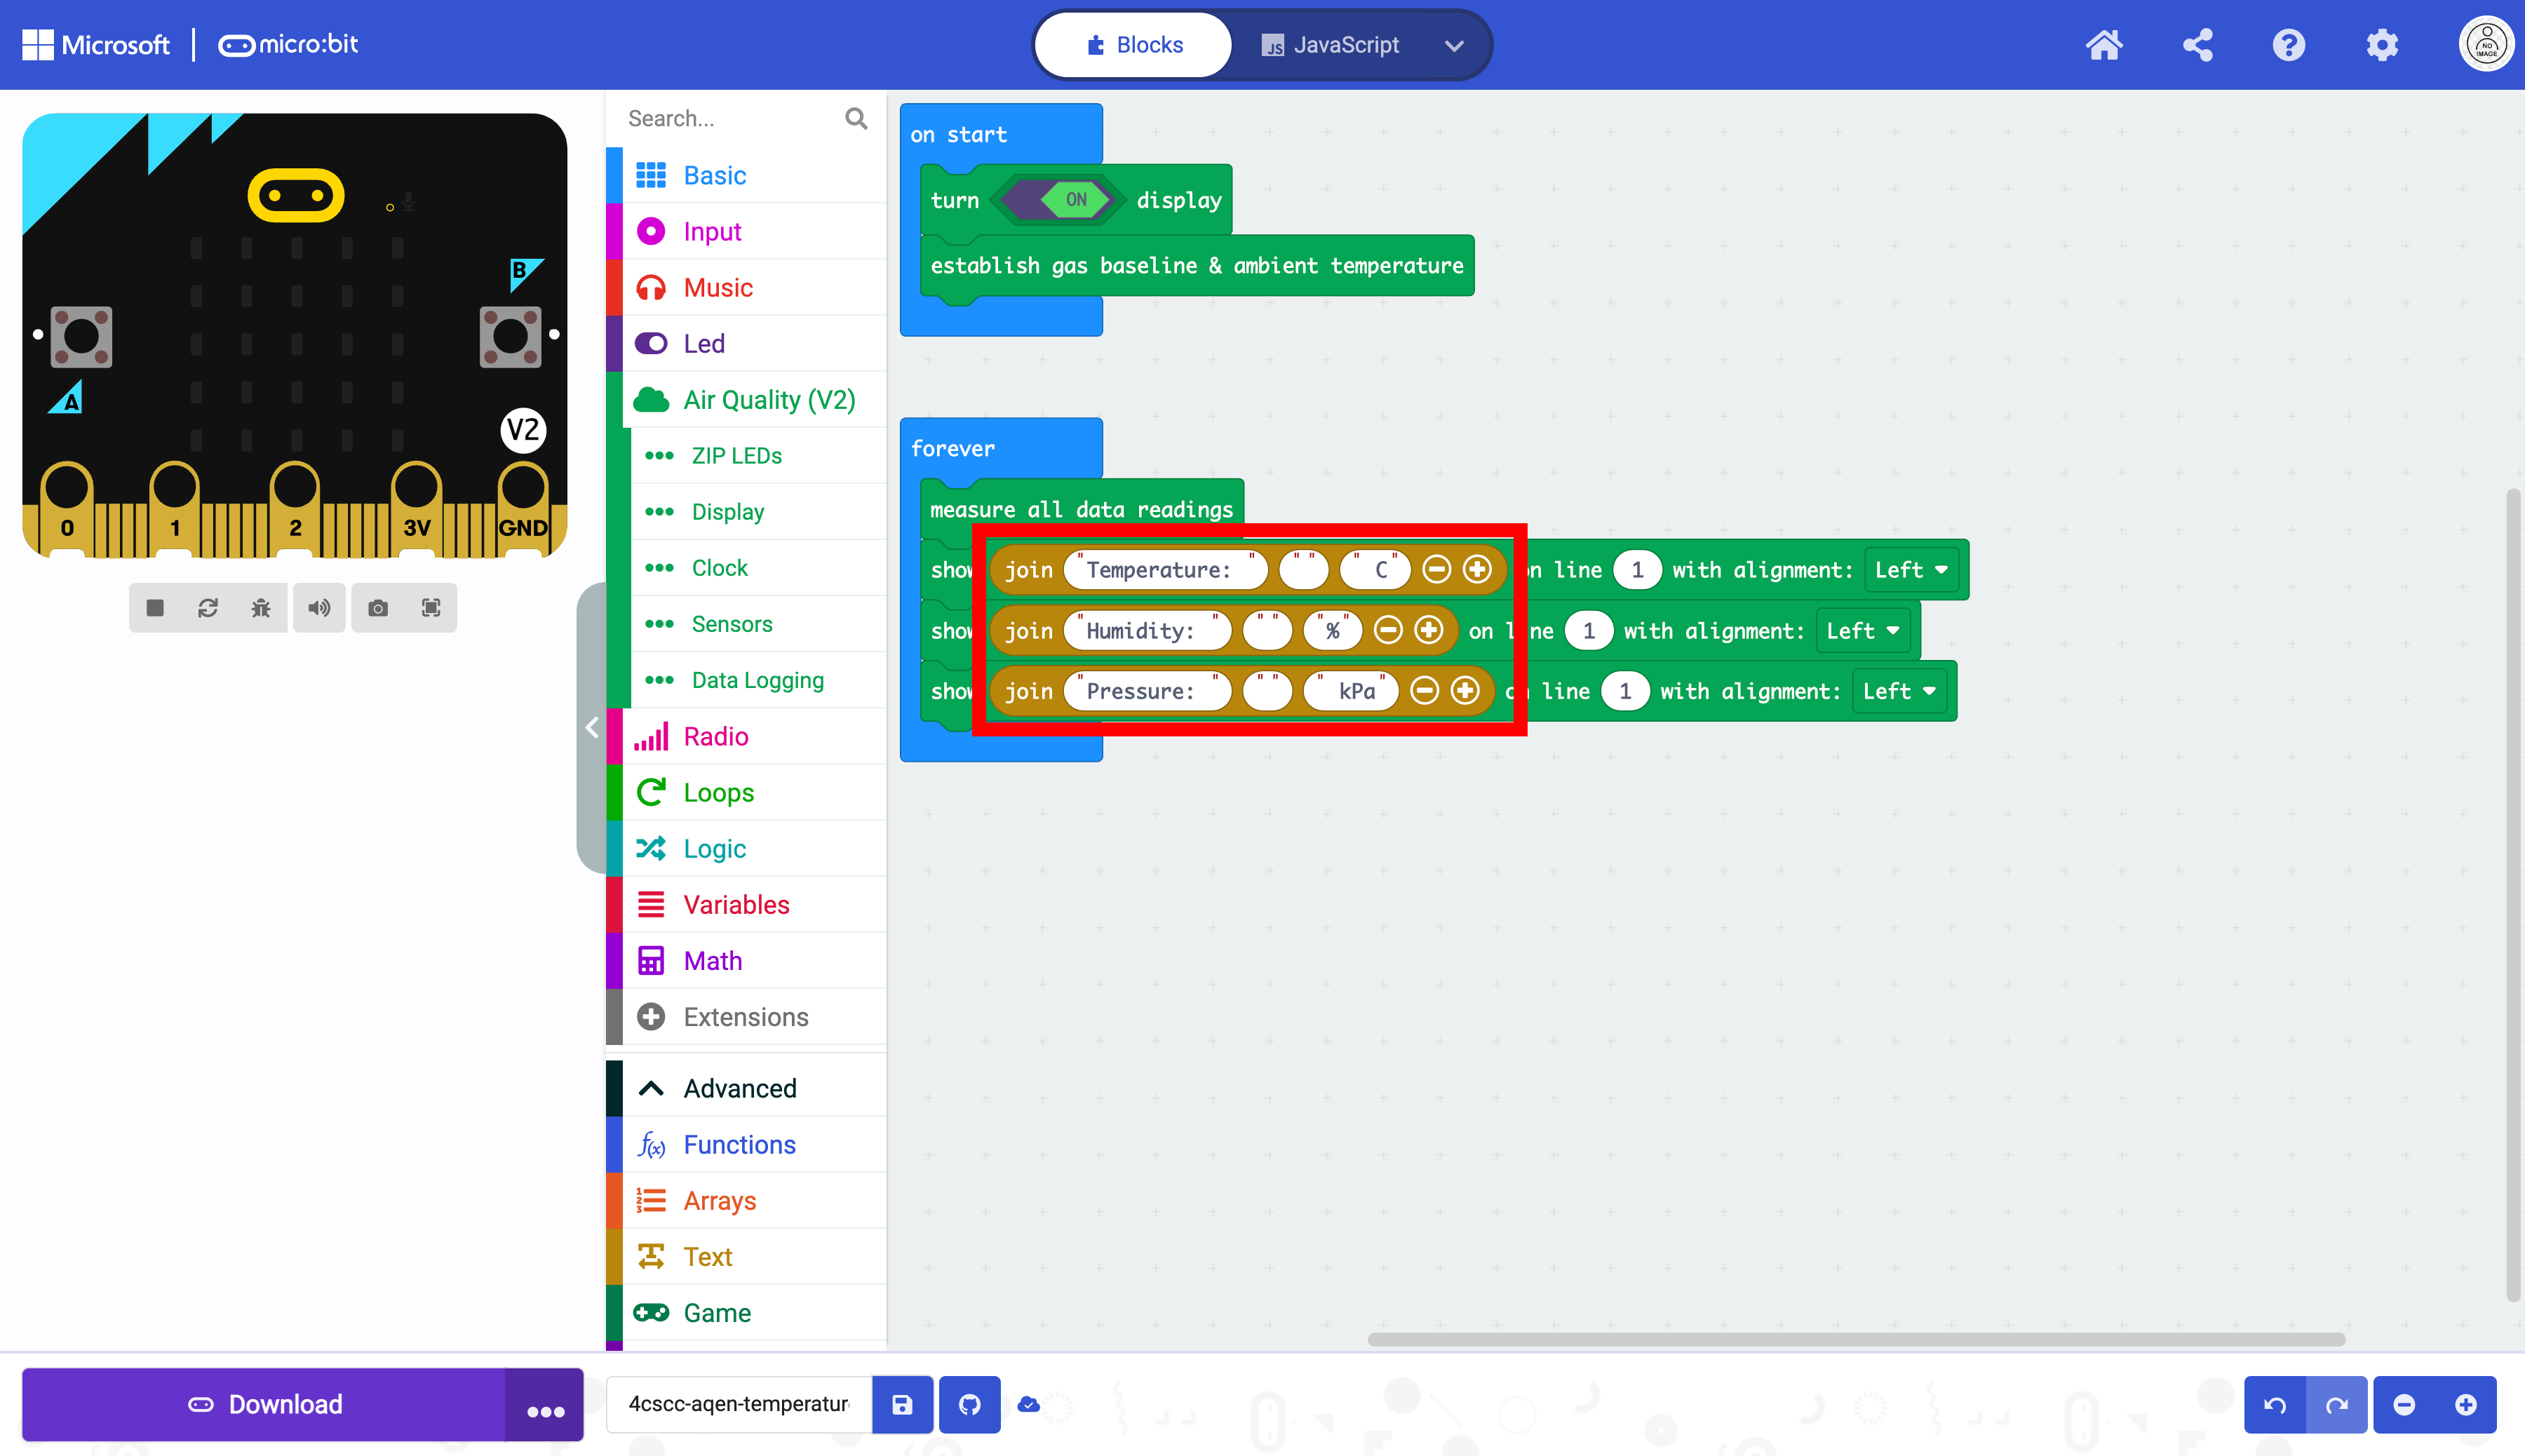
Enter the corresponding strings into the first and third ovals as determined above. The first oval is the variable to be measured (Temperature, Humidity, Pressure) and needs to be placed within “ “ to ensure the program knows this is a string. Notice that there are spaces called whitespace. These spaces are necessary to have the Data display correctly. The third oval contains the labels for the units of measurement (C, %, kPa)
String 1 |
String 2 |
String 3 |
|---|---|---|
|
|
|
|
|
|
|
|
|
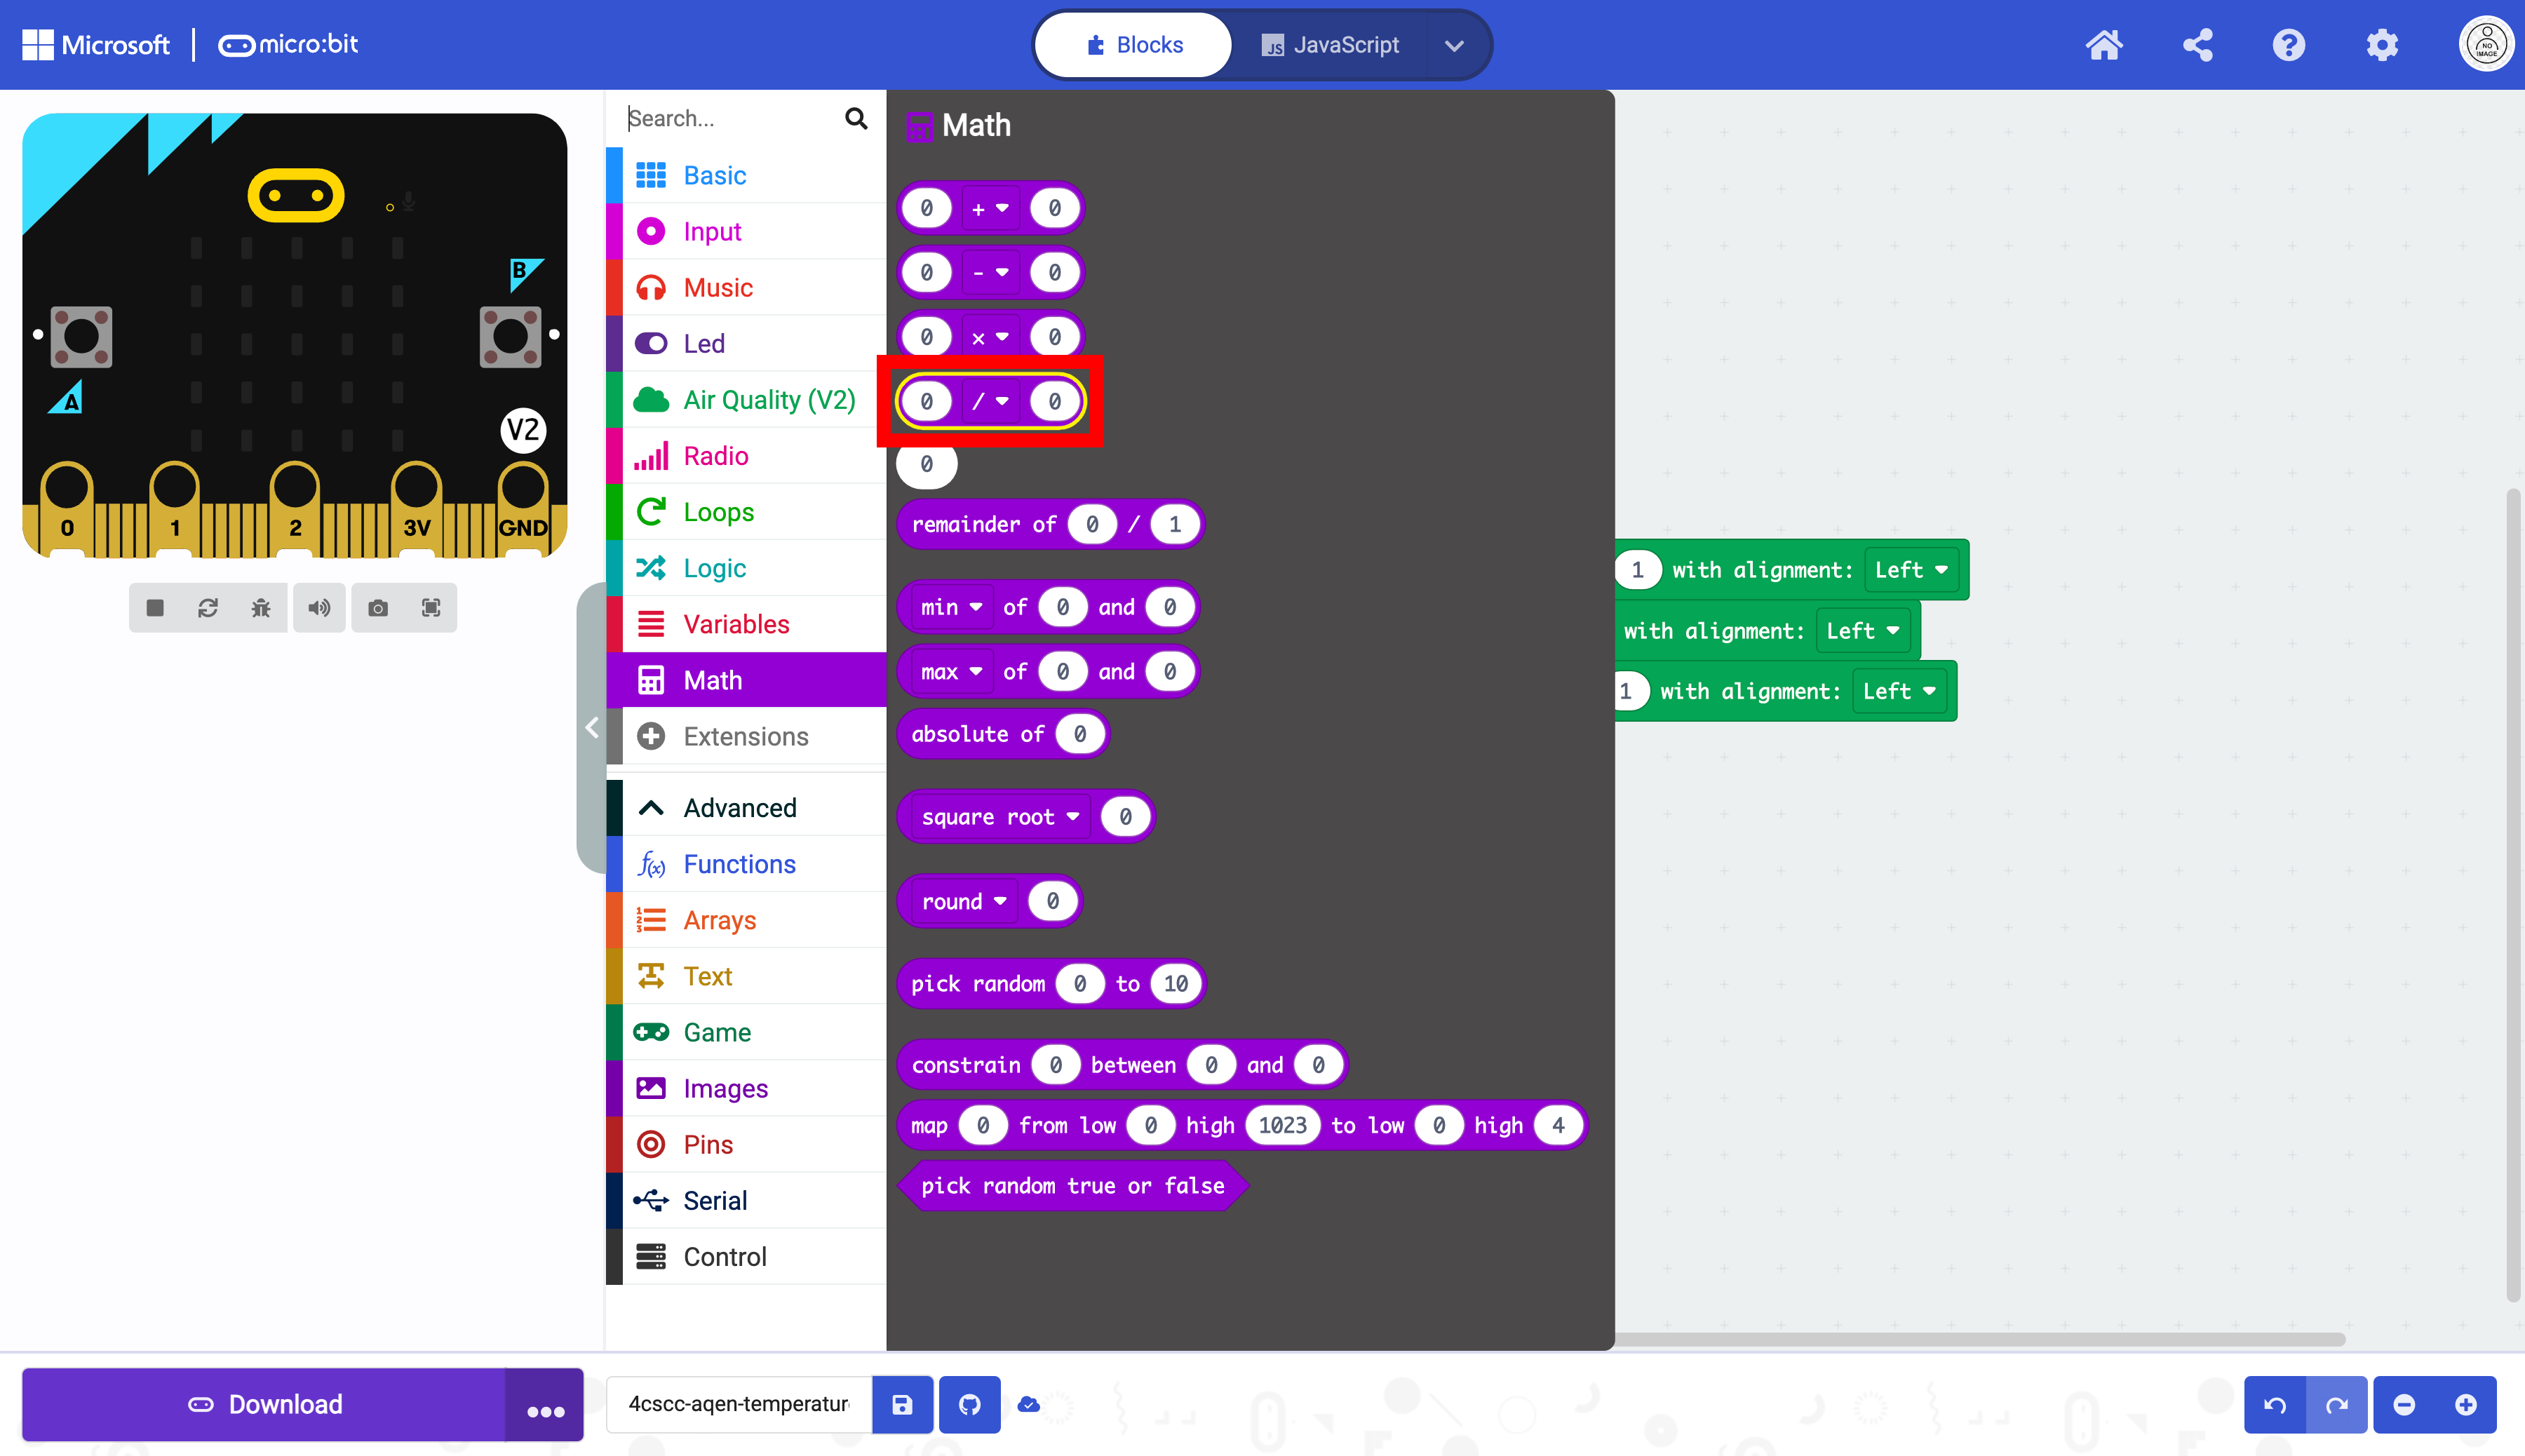
The board reads atmospheric pressure in pascals. The preferred scale is kilopascals. There are 1000 pascals in one kilopascal. The output must be divided by 1000 to convert it to kilopascals. This requires a little math in the code. Select the Math drawer.
Look for the division block.
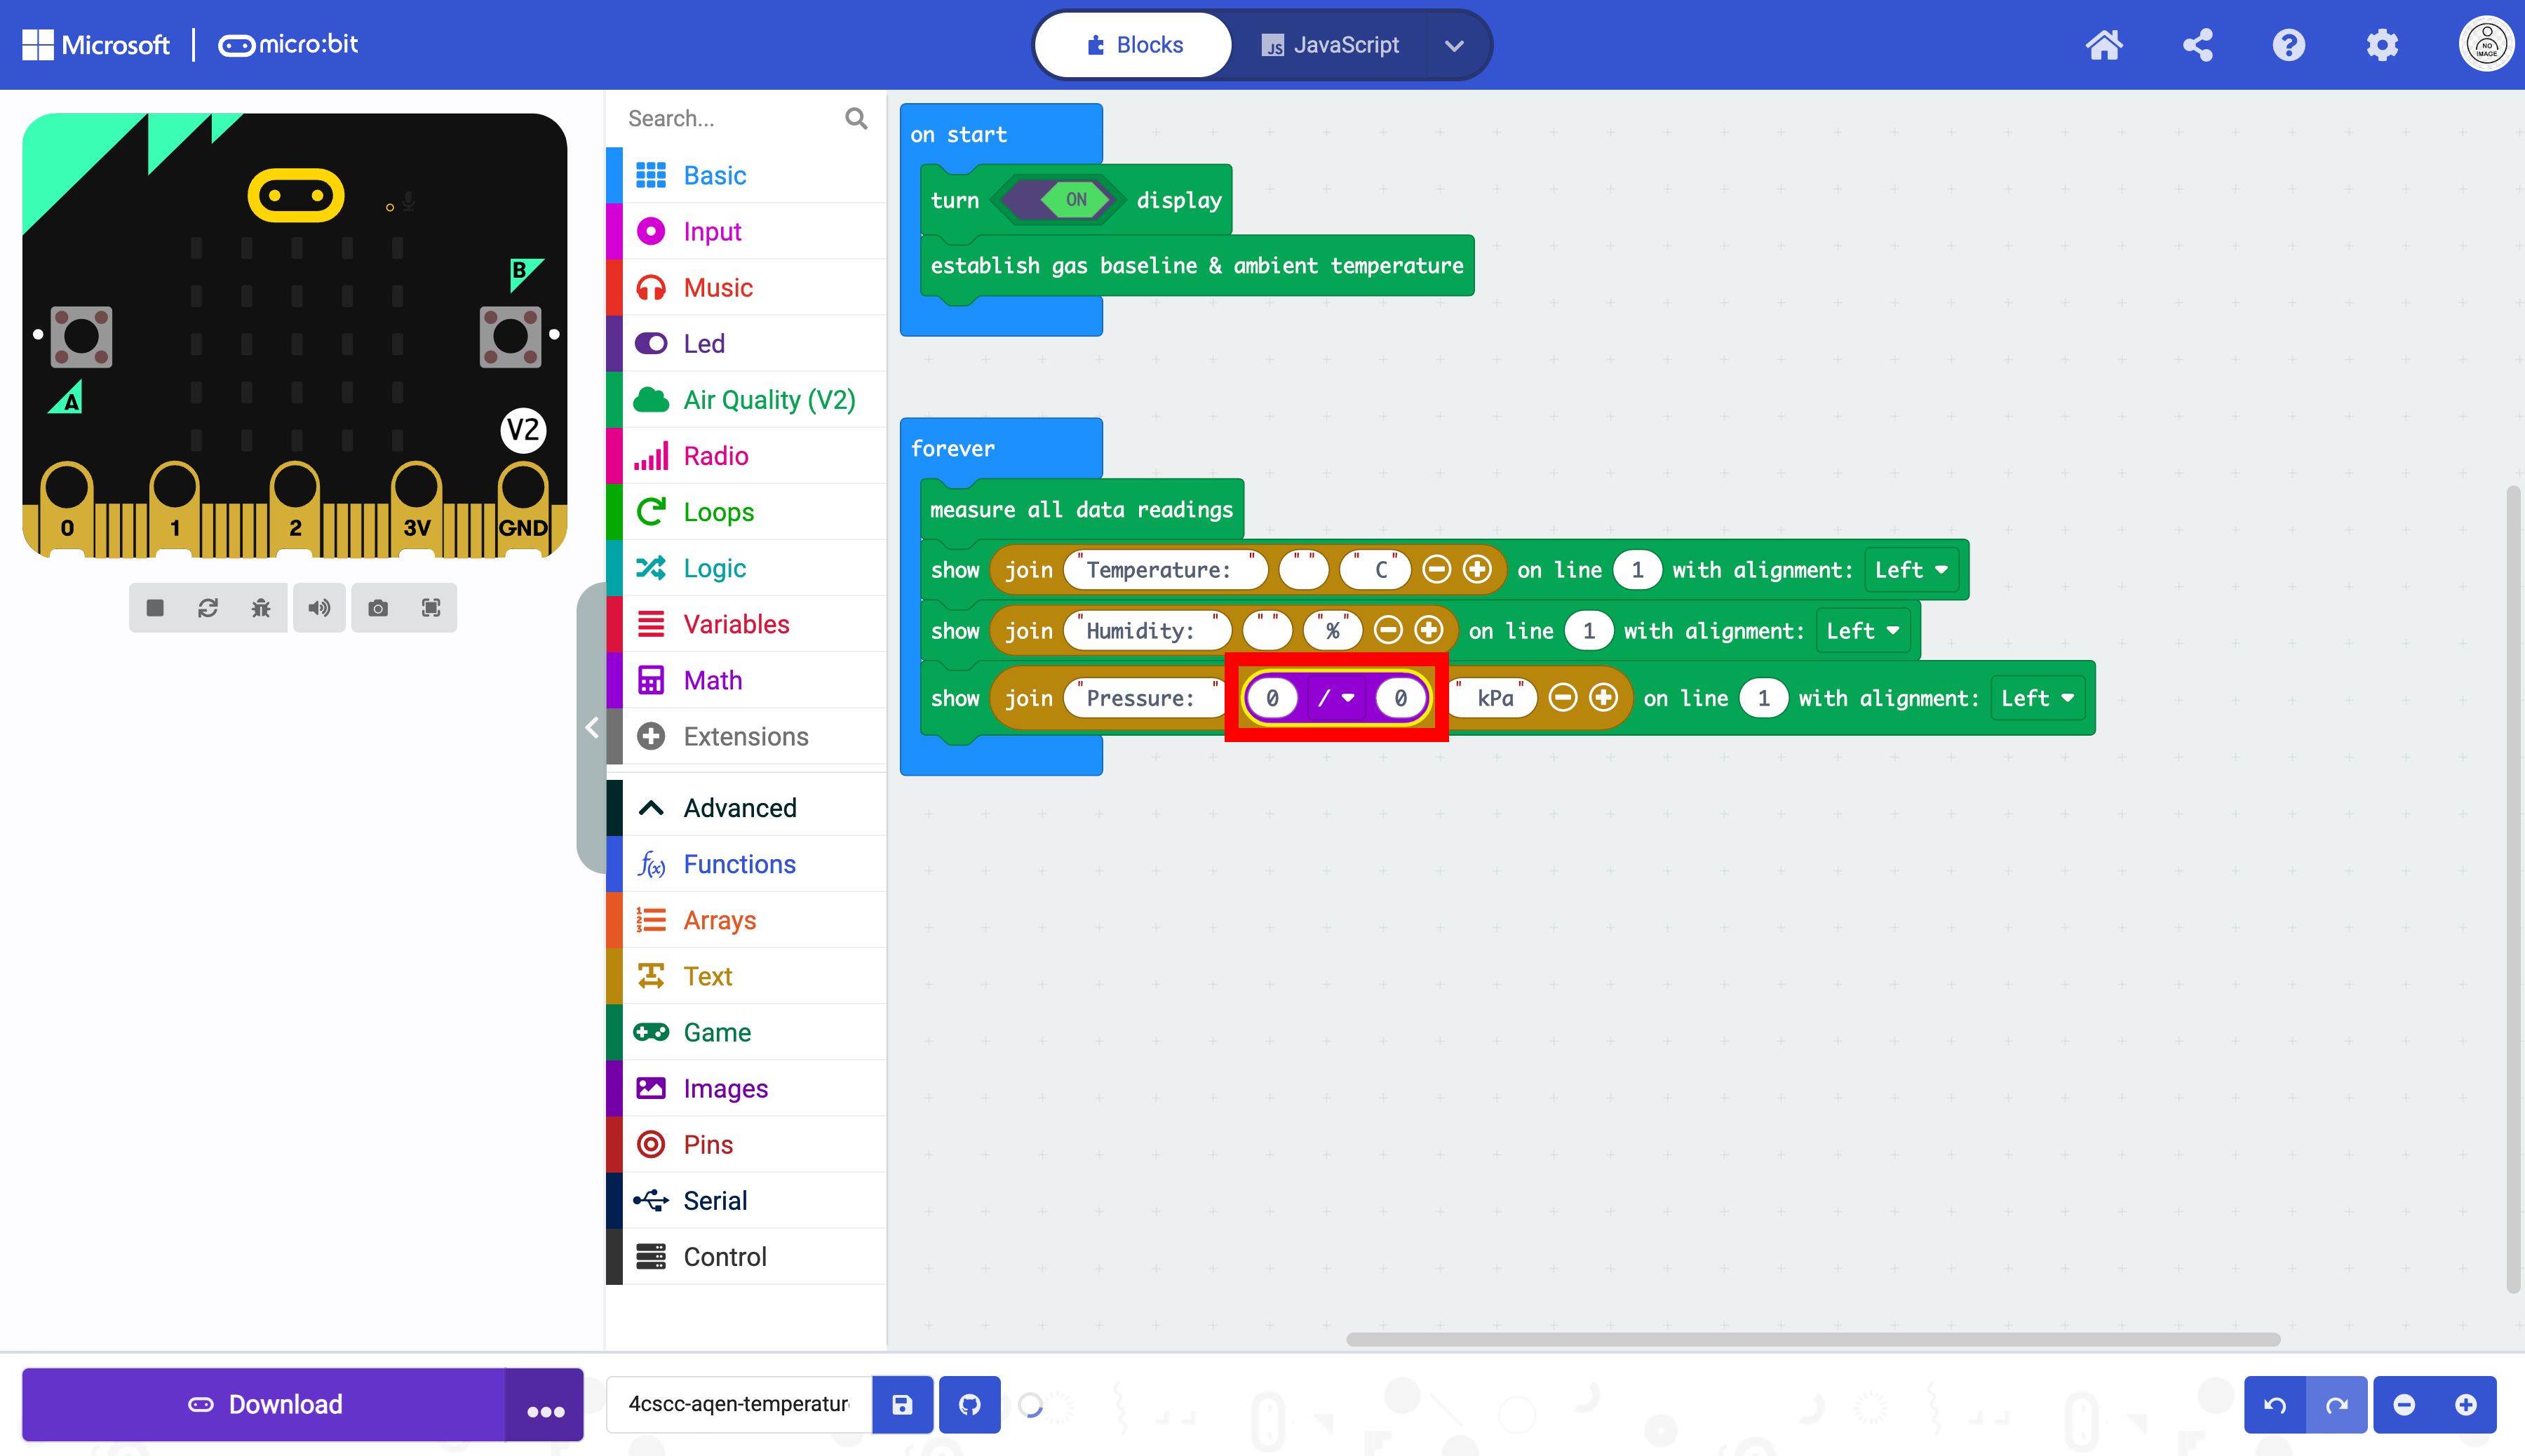
Drag the division block into the second oval (string) of the Pressure block.
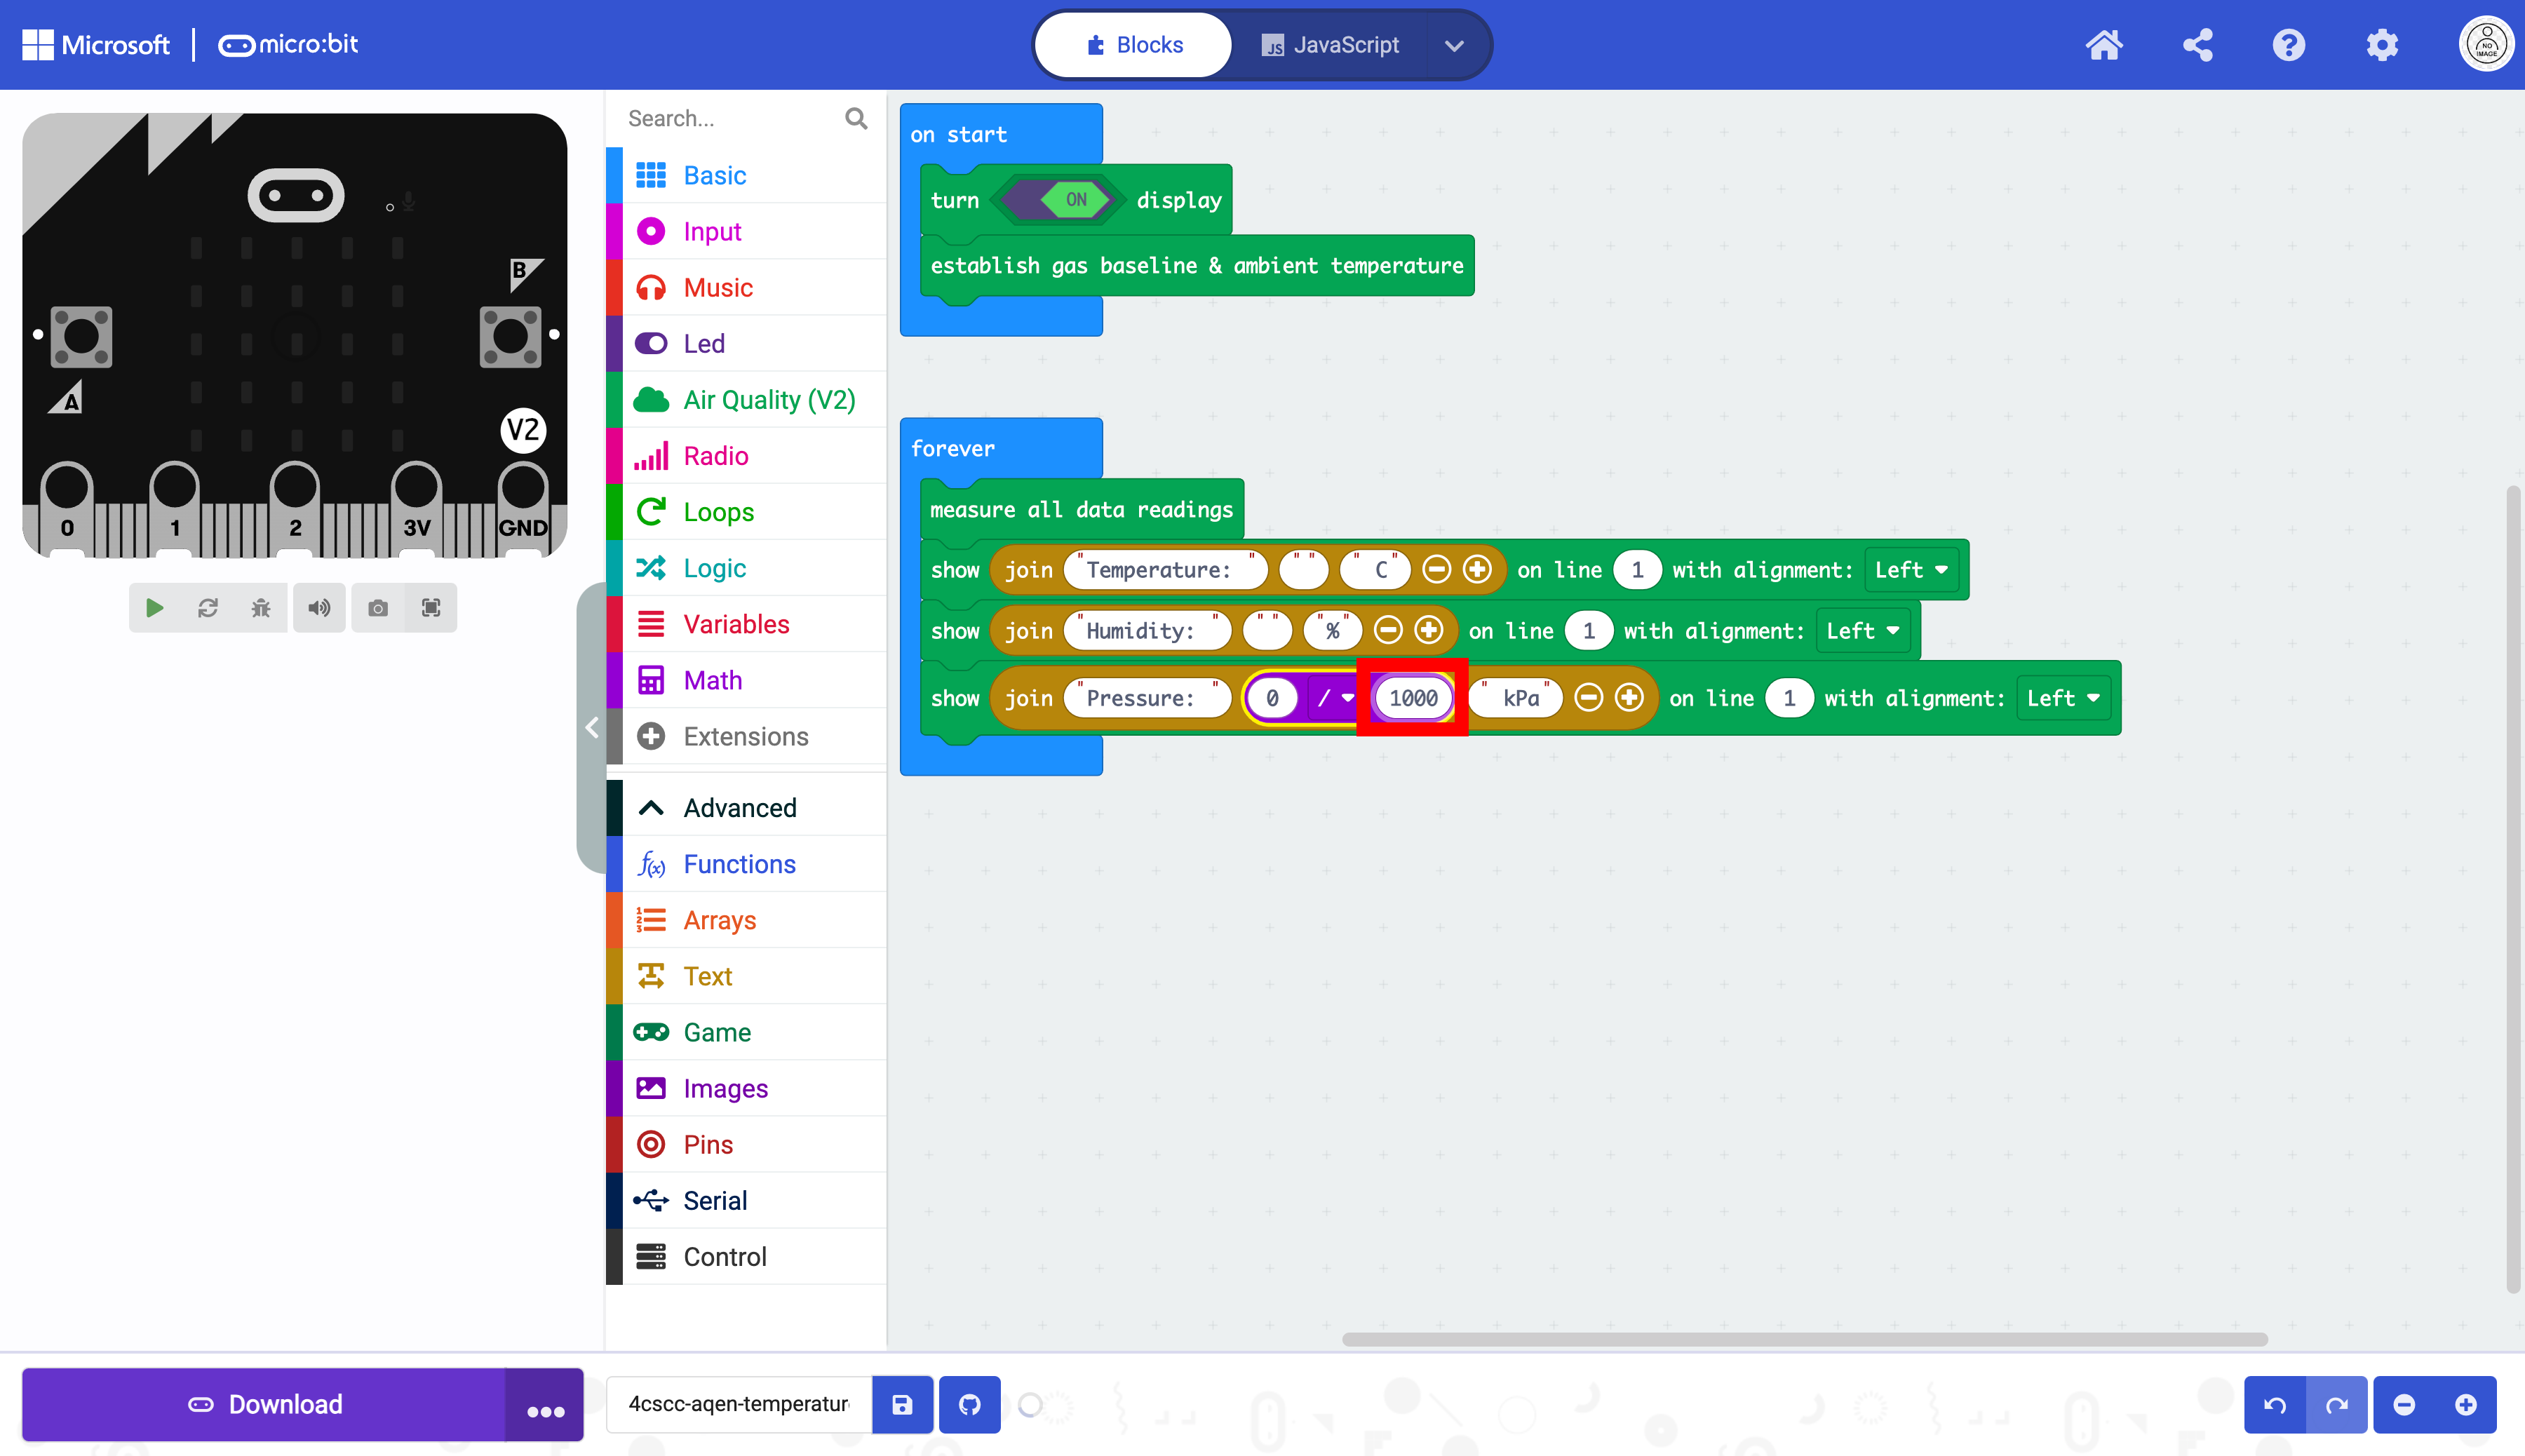
Type 1000 as the divisor of the division block.
Select the “Sensor” drawer.
Select the Read Temperature in, Read Pressure in, and Read Humidity blocks
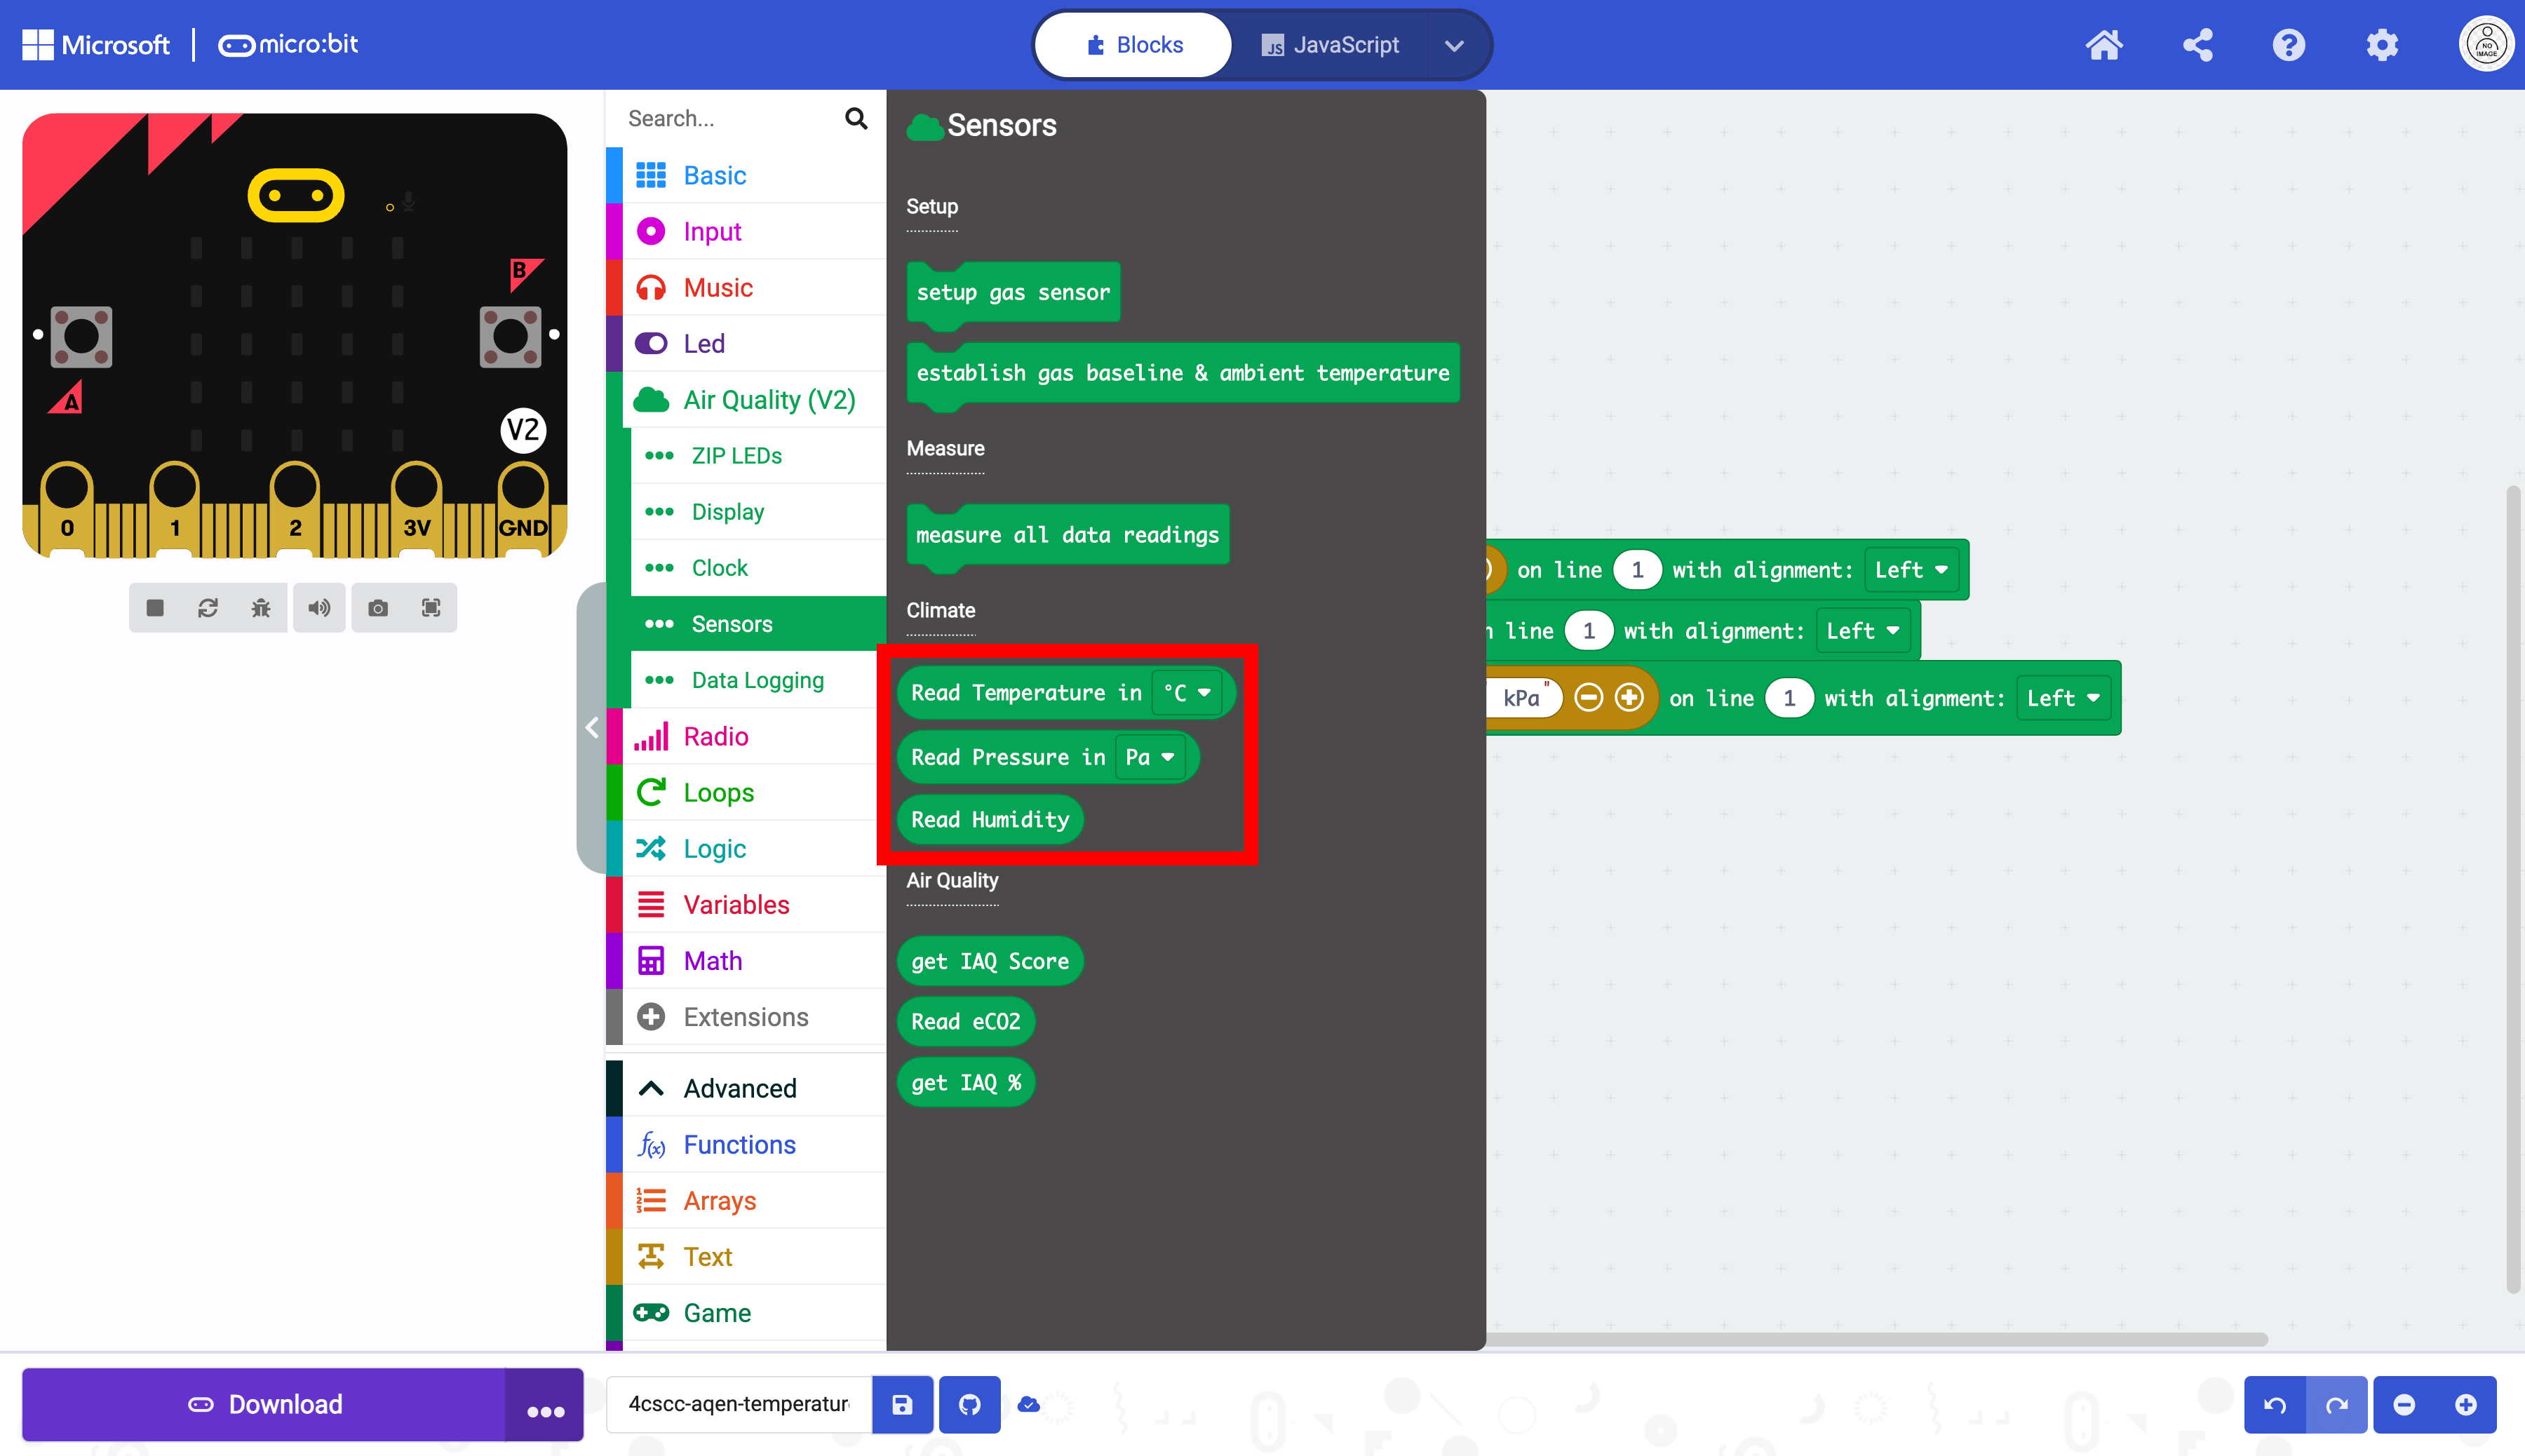
Place them in the corresponding text fields (second oval). Make sure that the Read Pressure in block is the dividend (top) of the division block.
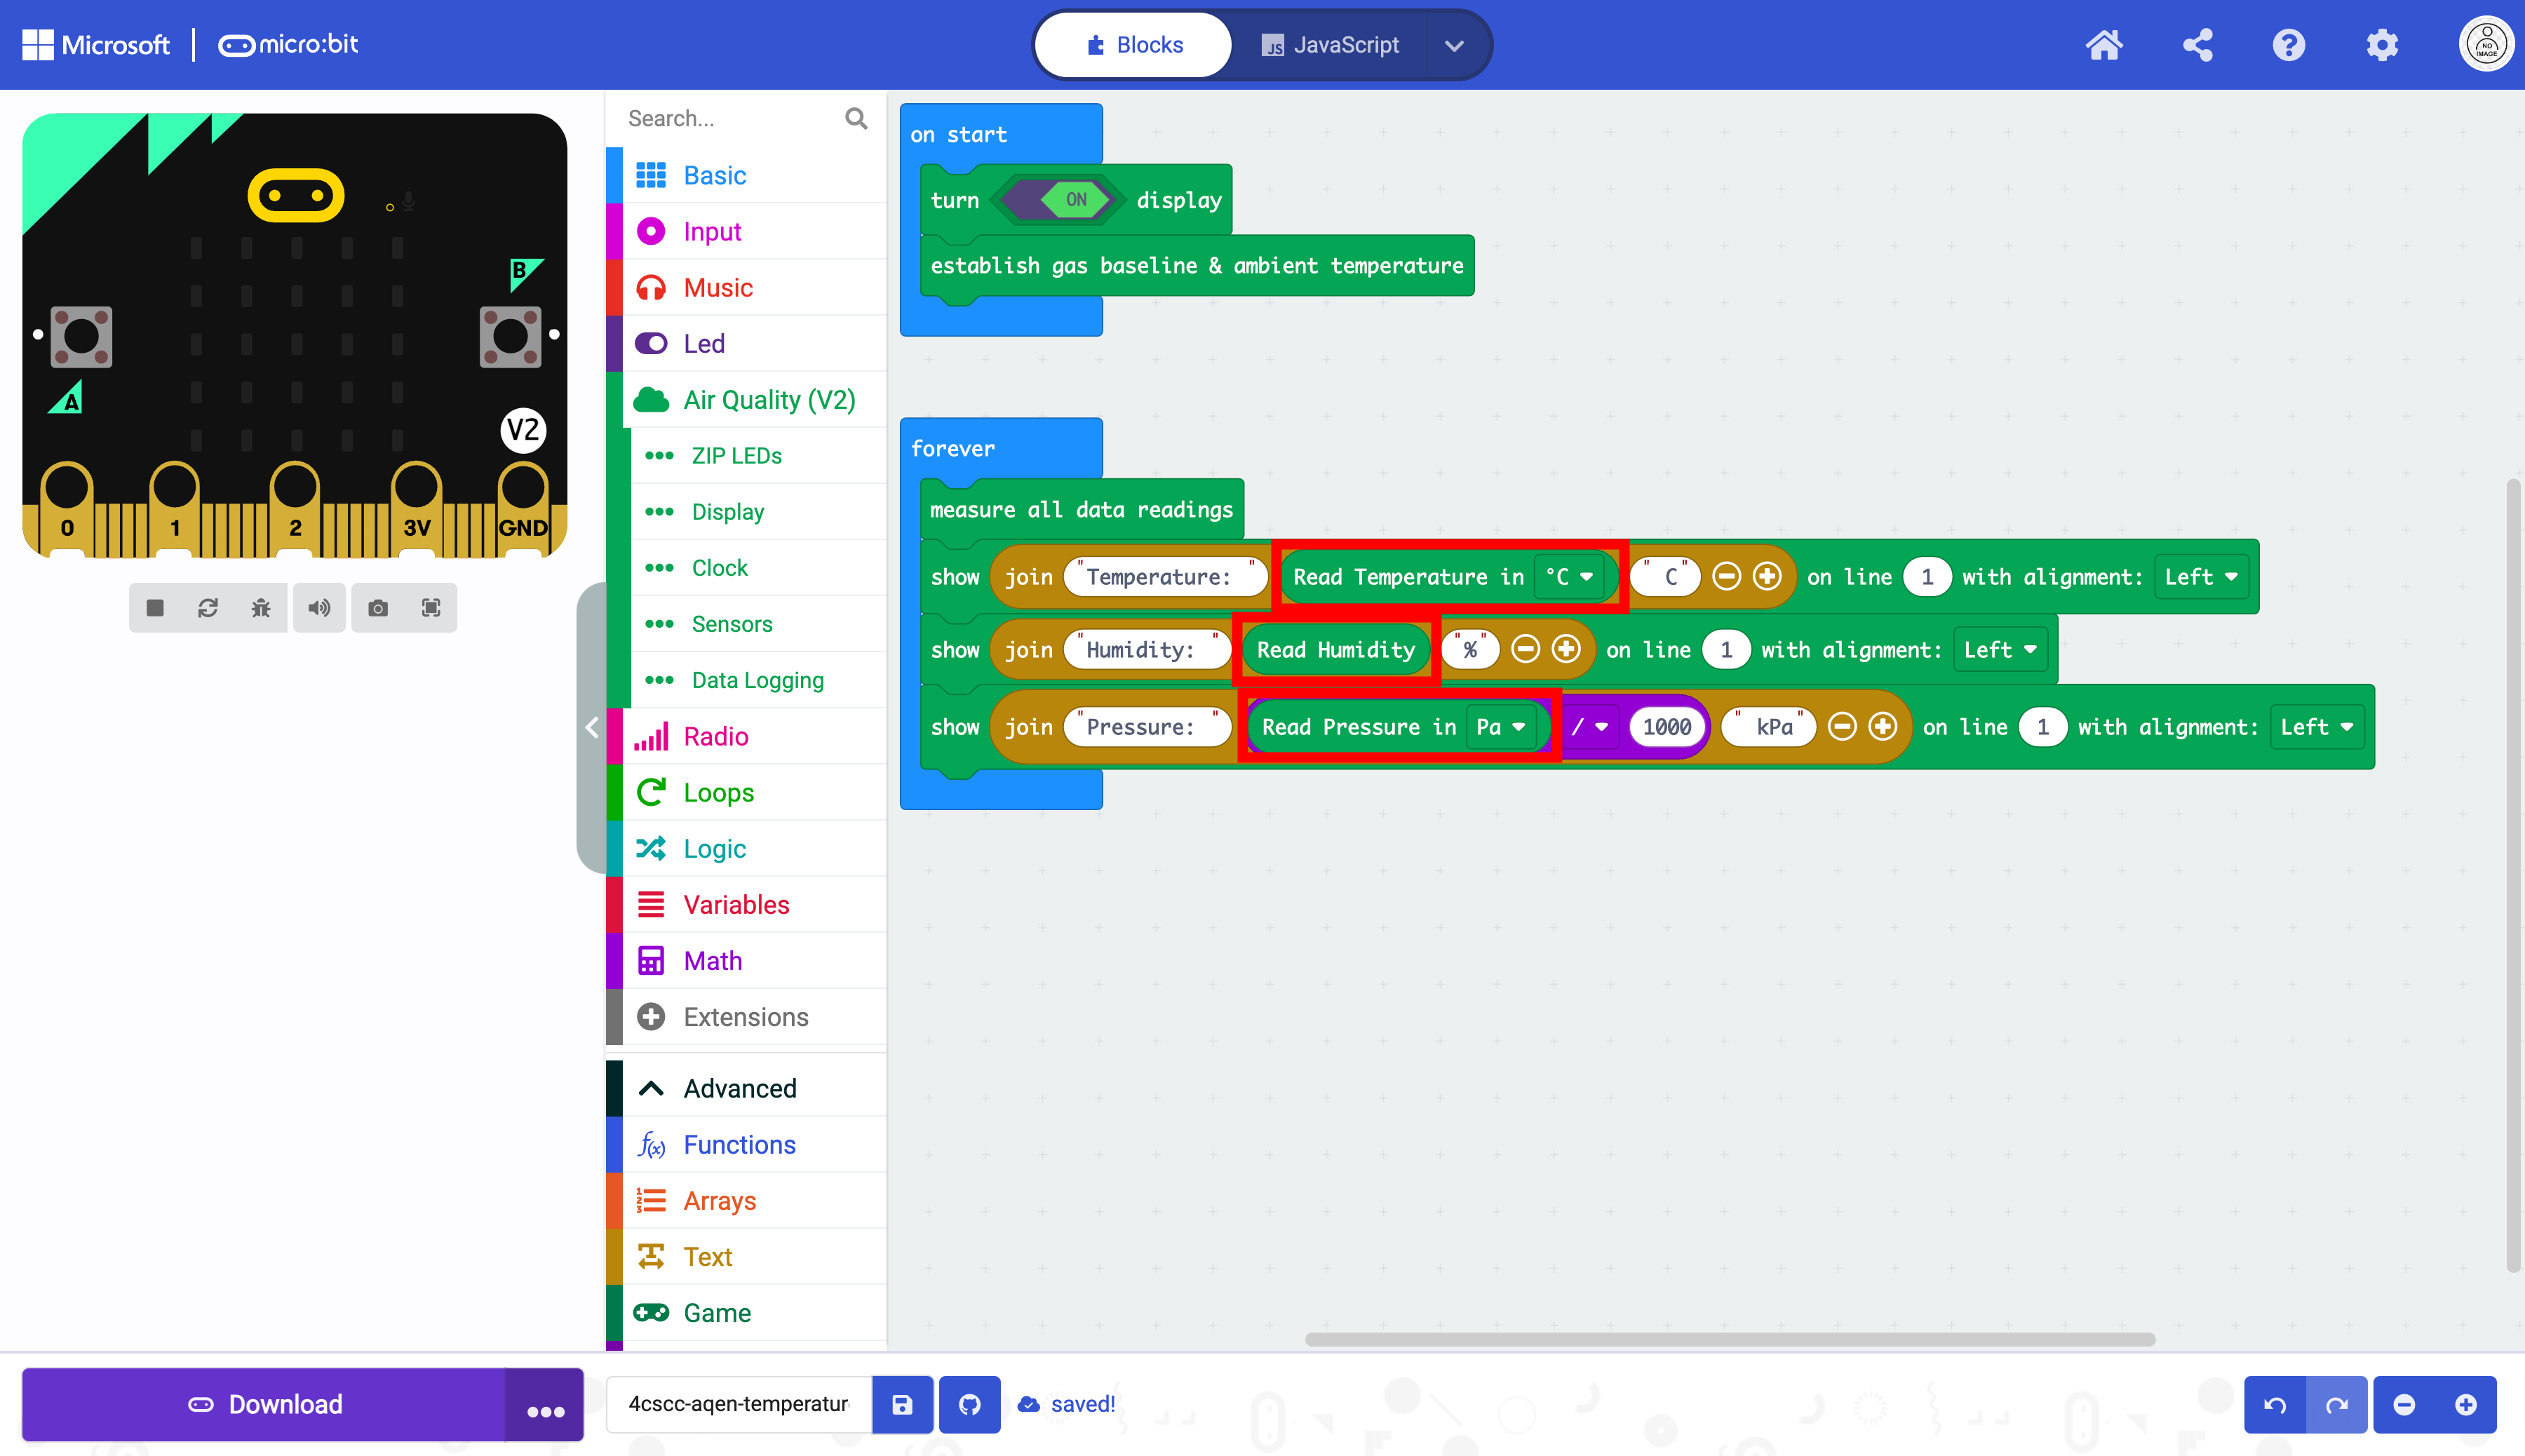
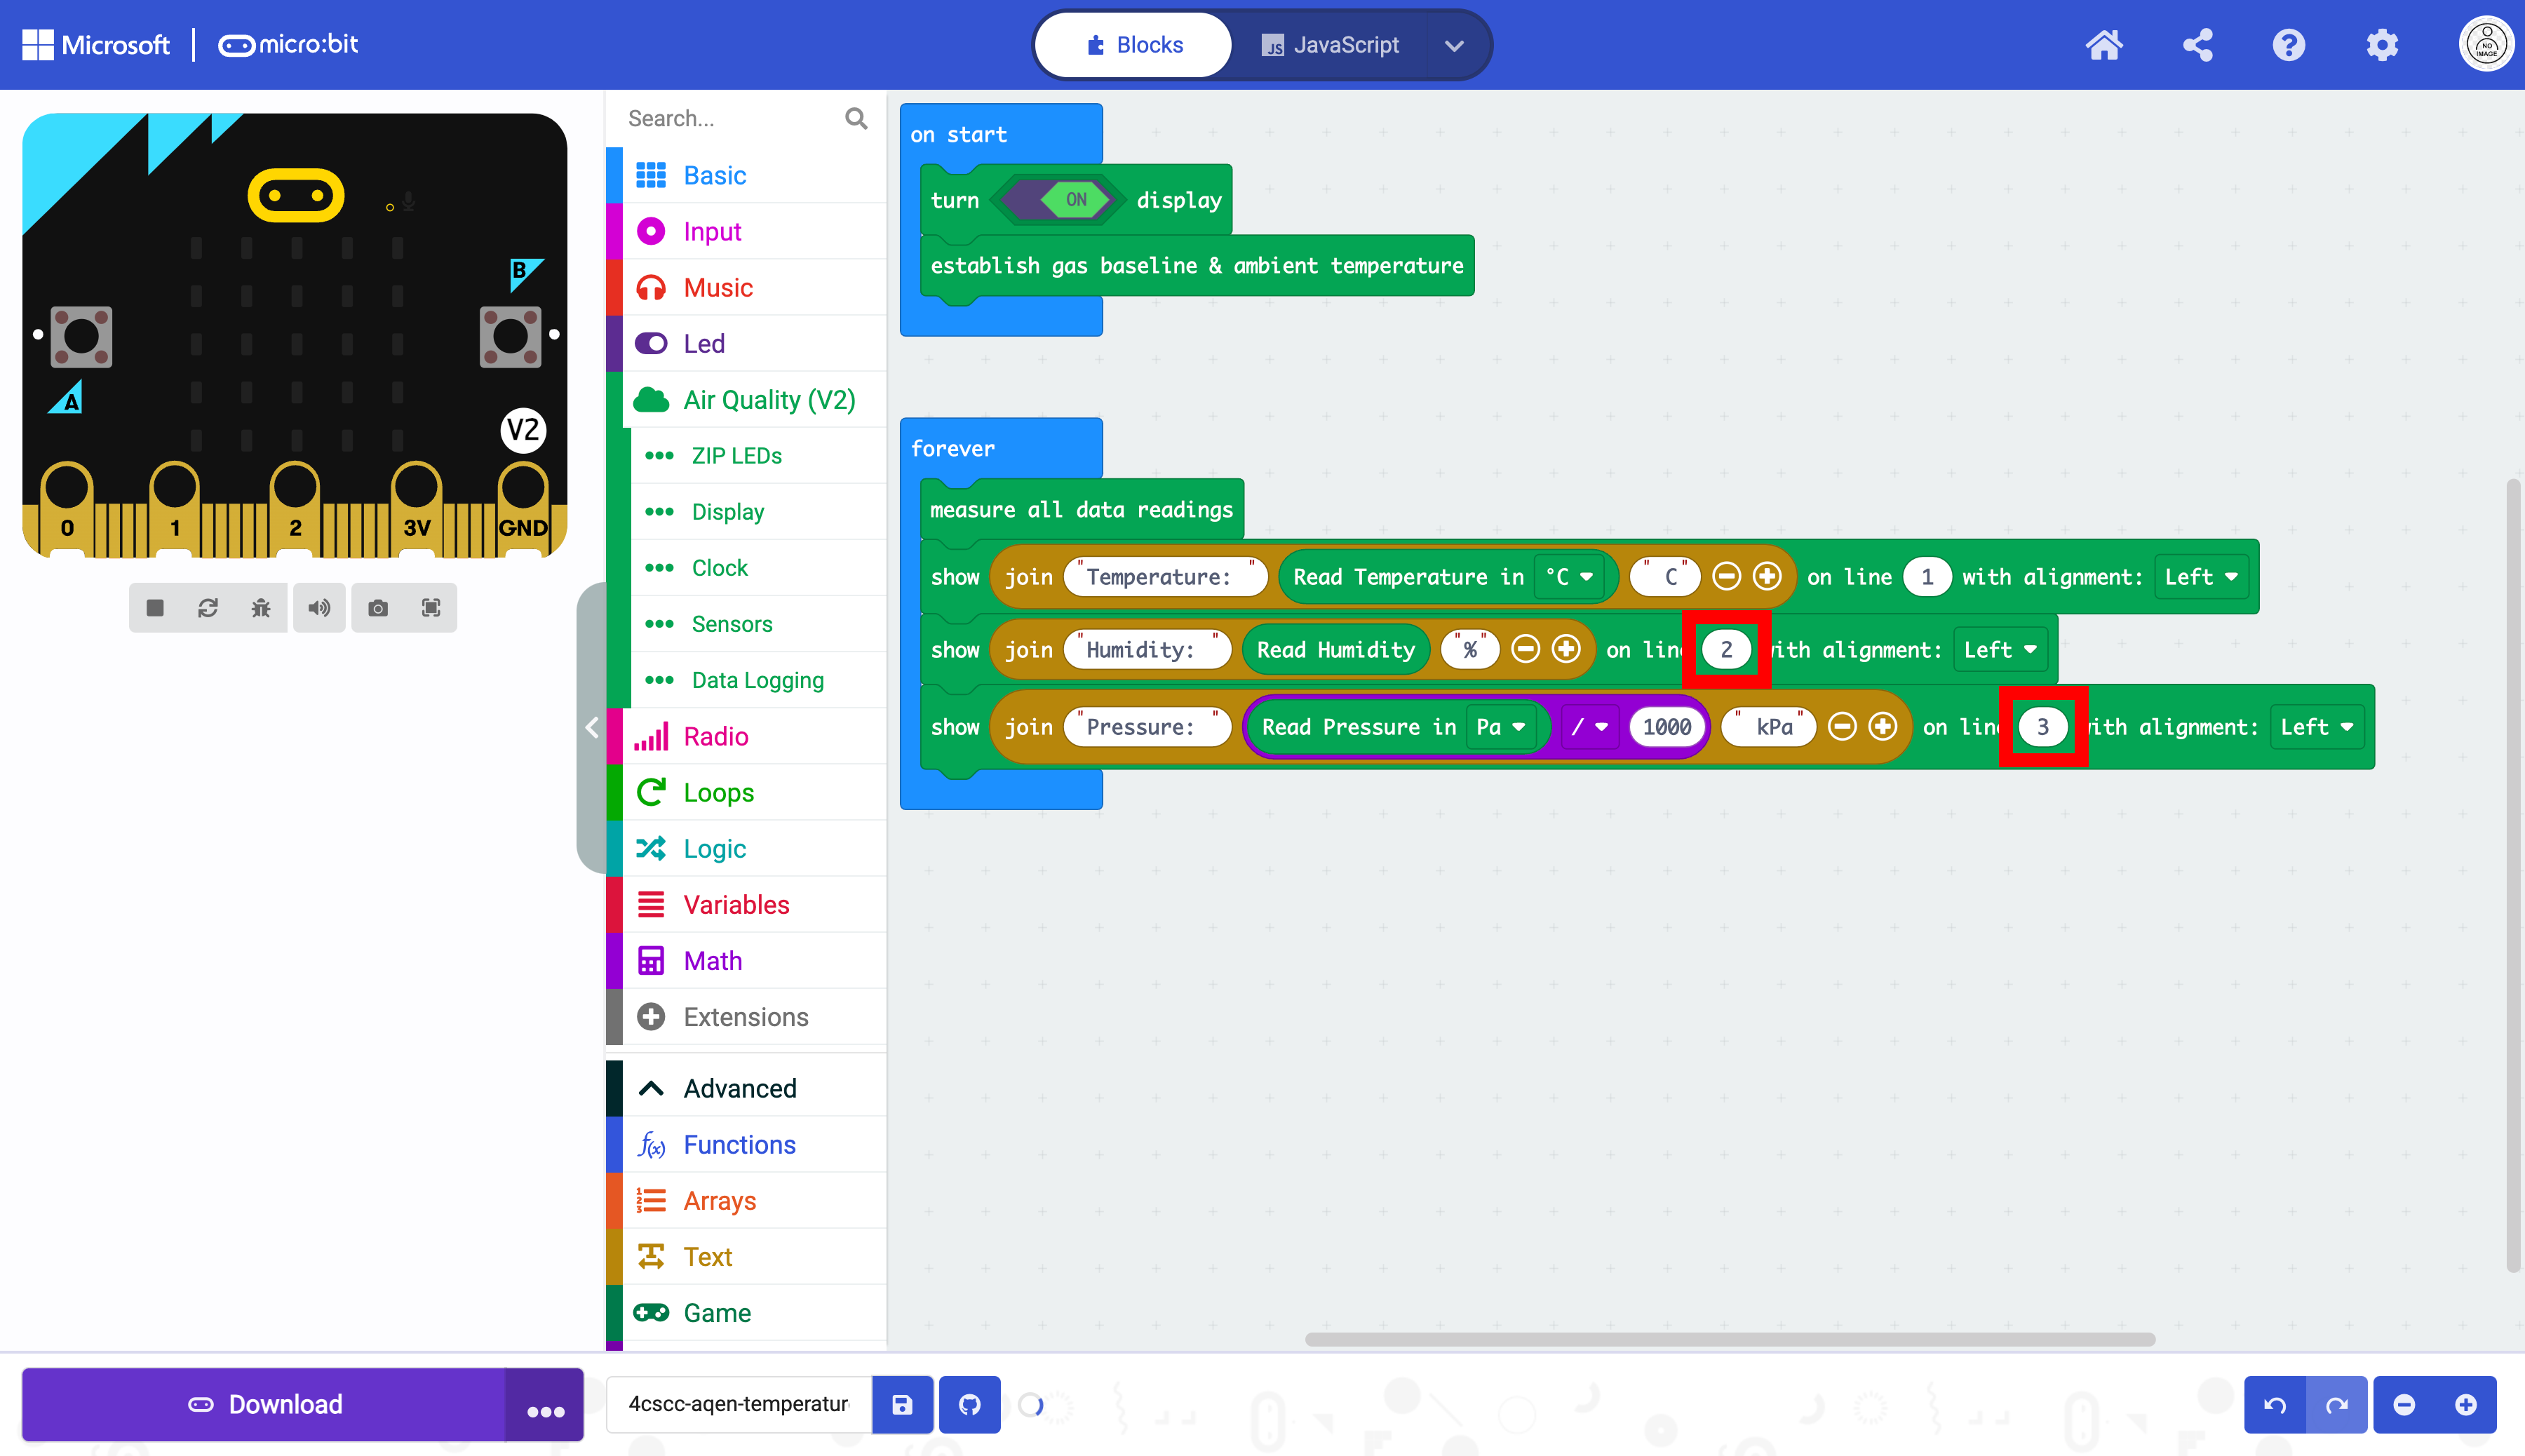
The code, as it is, will output the text for all three measurements on the first line with only one visible.

Change the line numbers to 2 and 3.
The code is almost complete. The only thing needed now is a pause block. This will help give a more accurate reading from the sensors. Select the Basic drawer in the Toolbox.
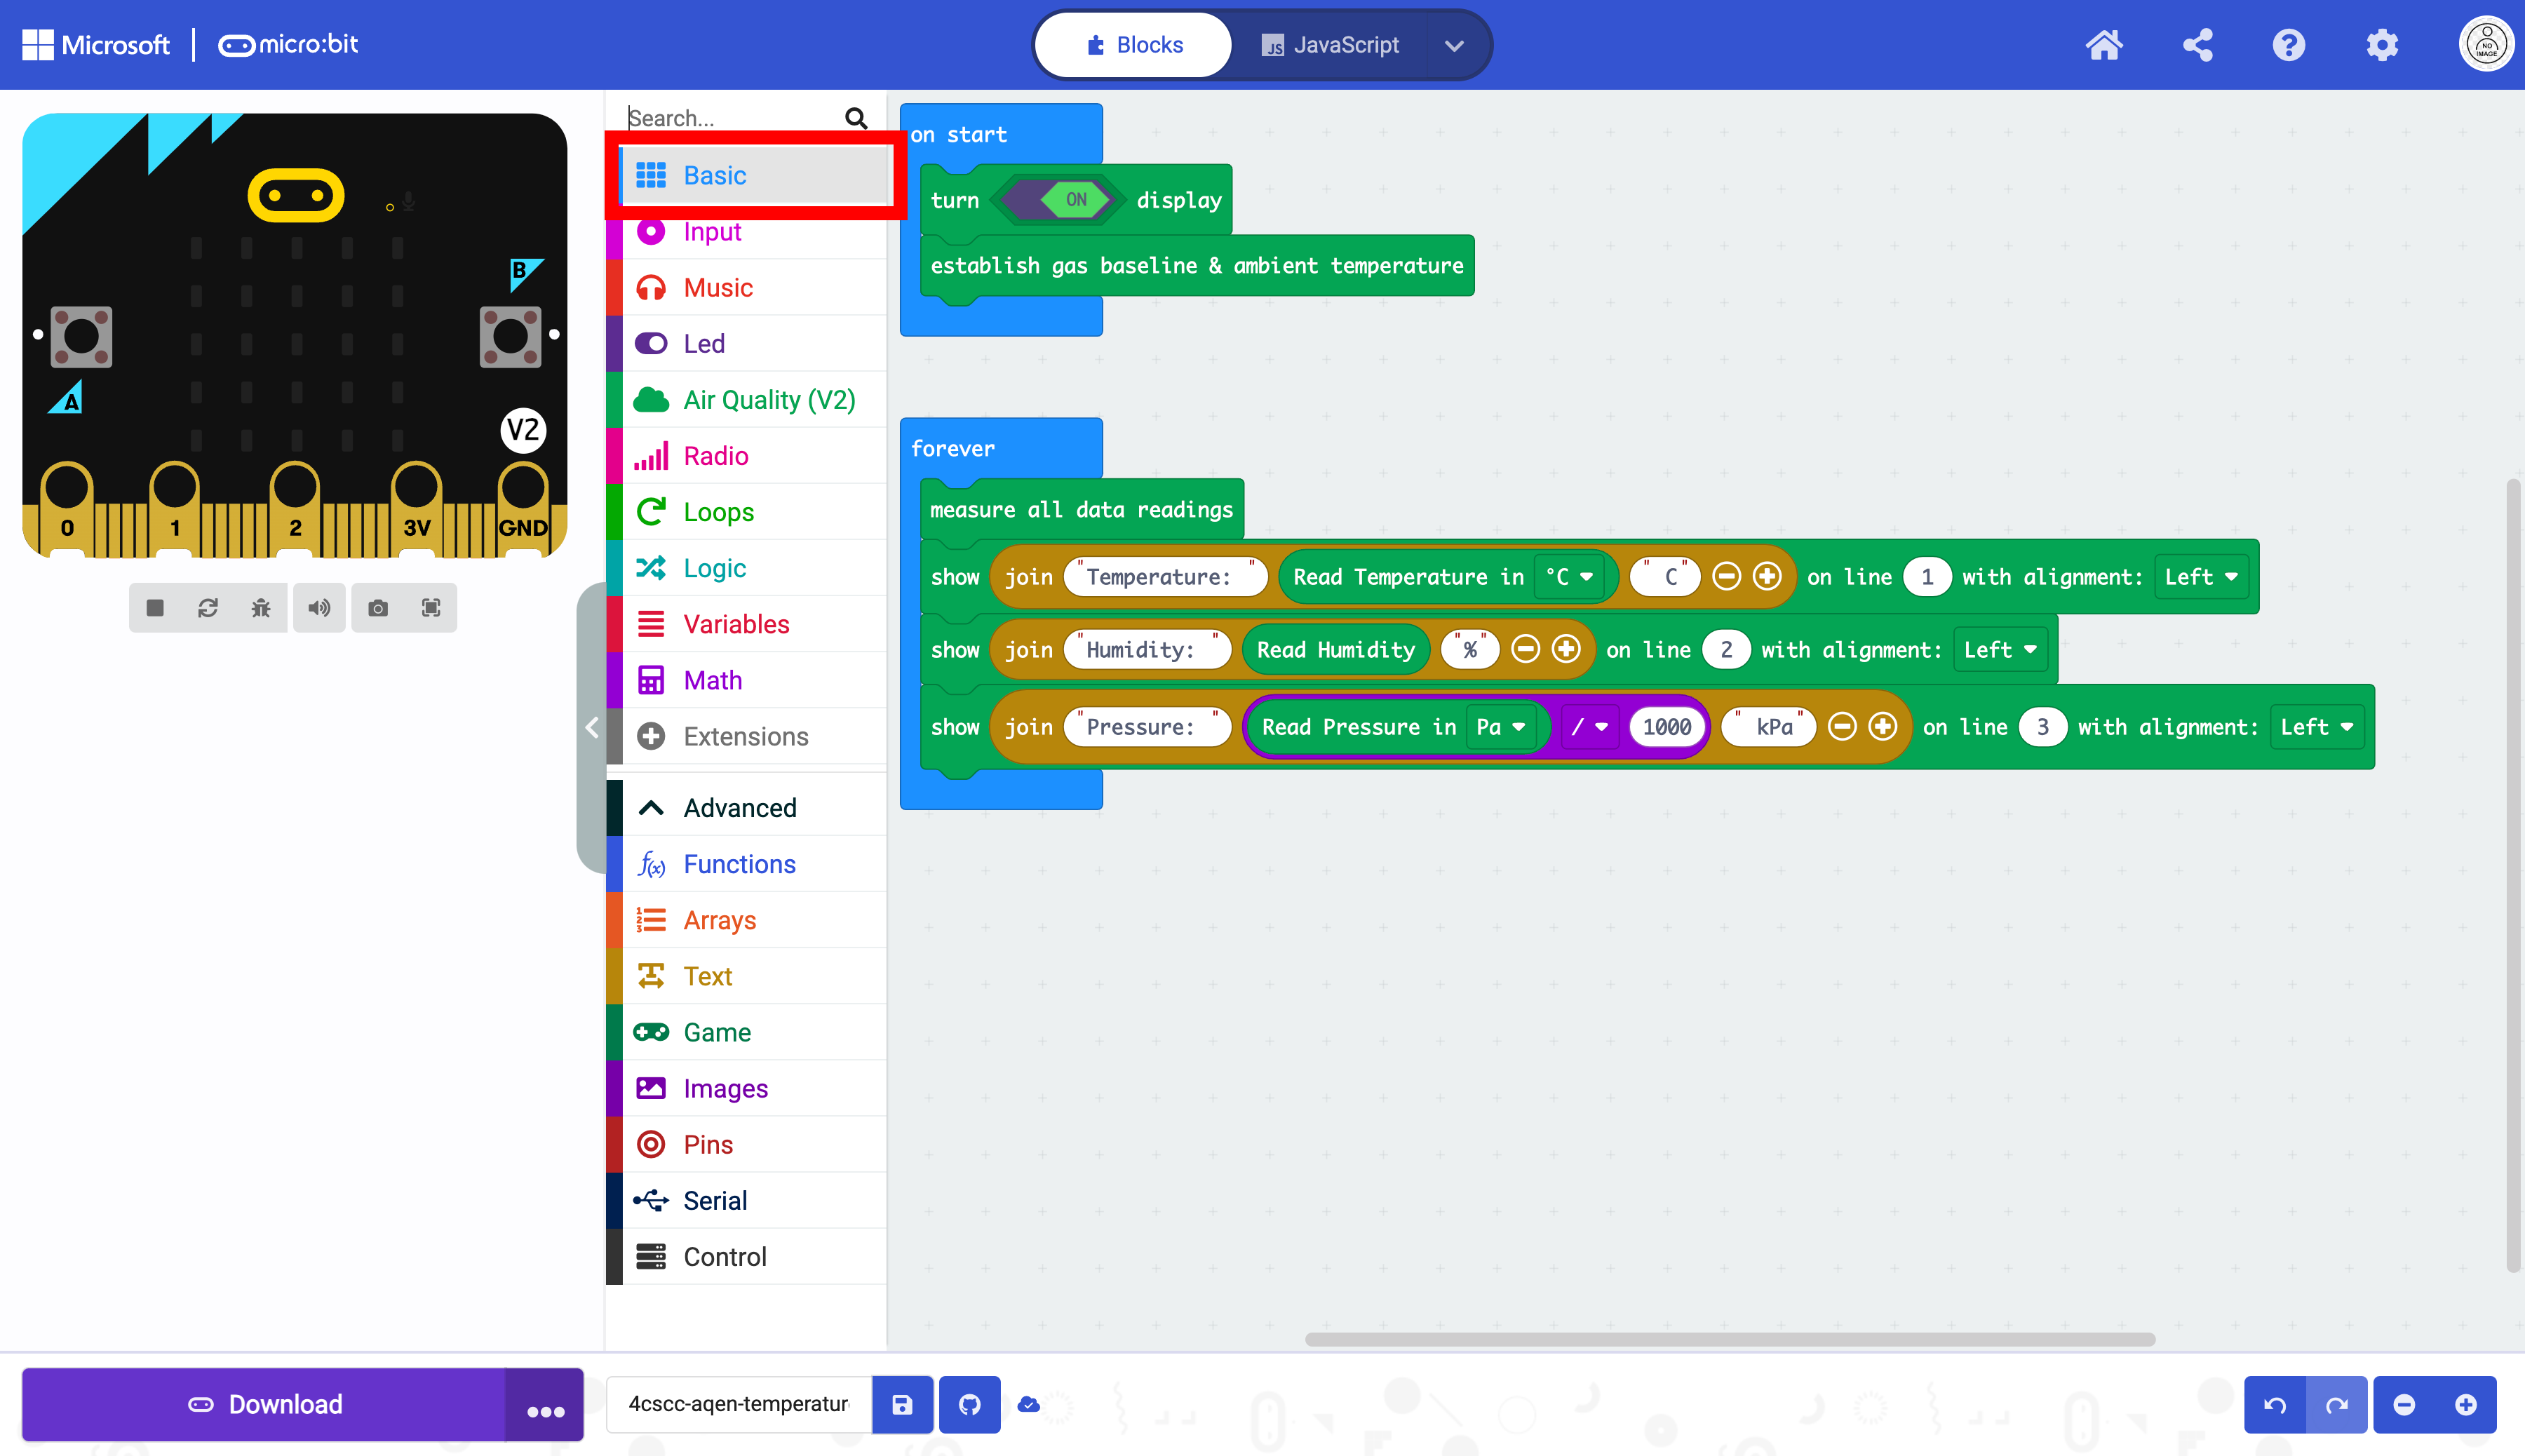
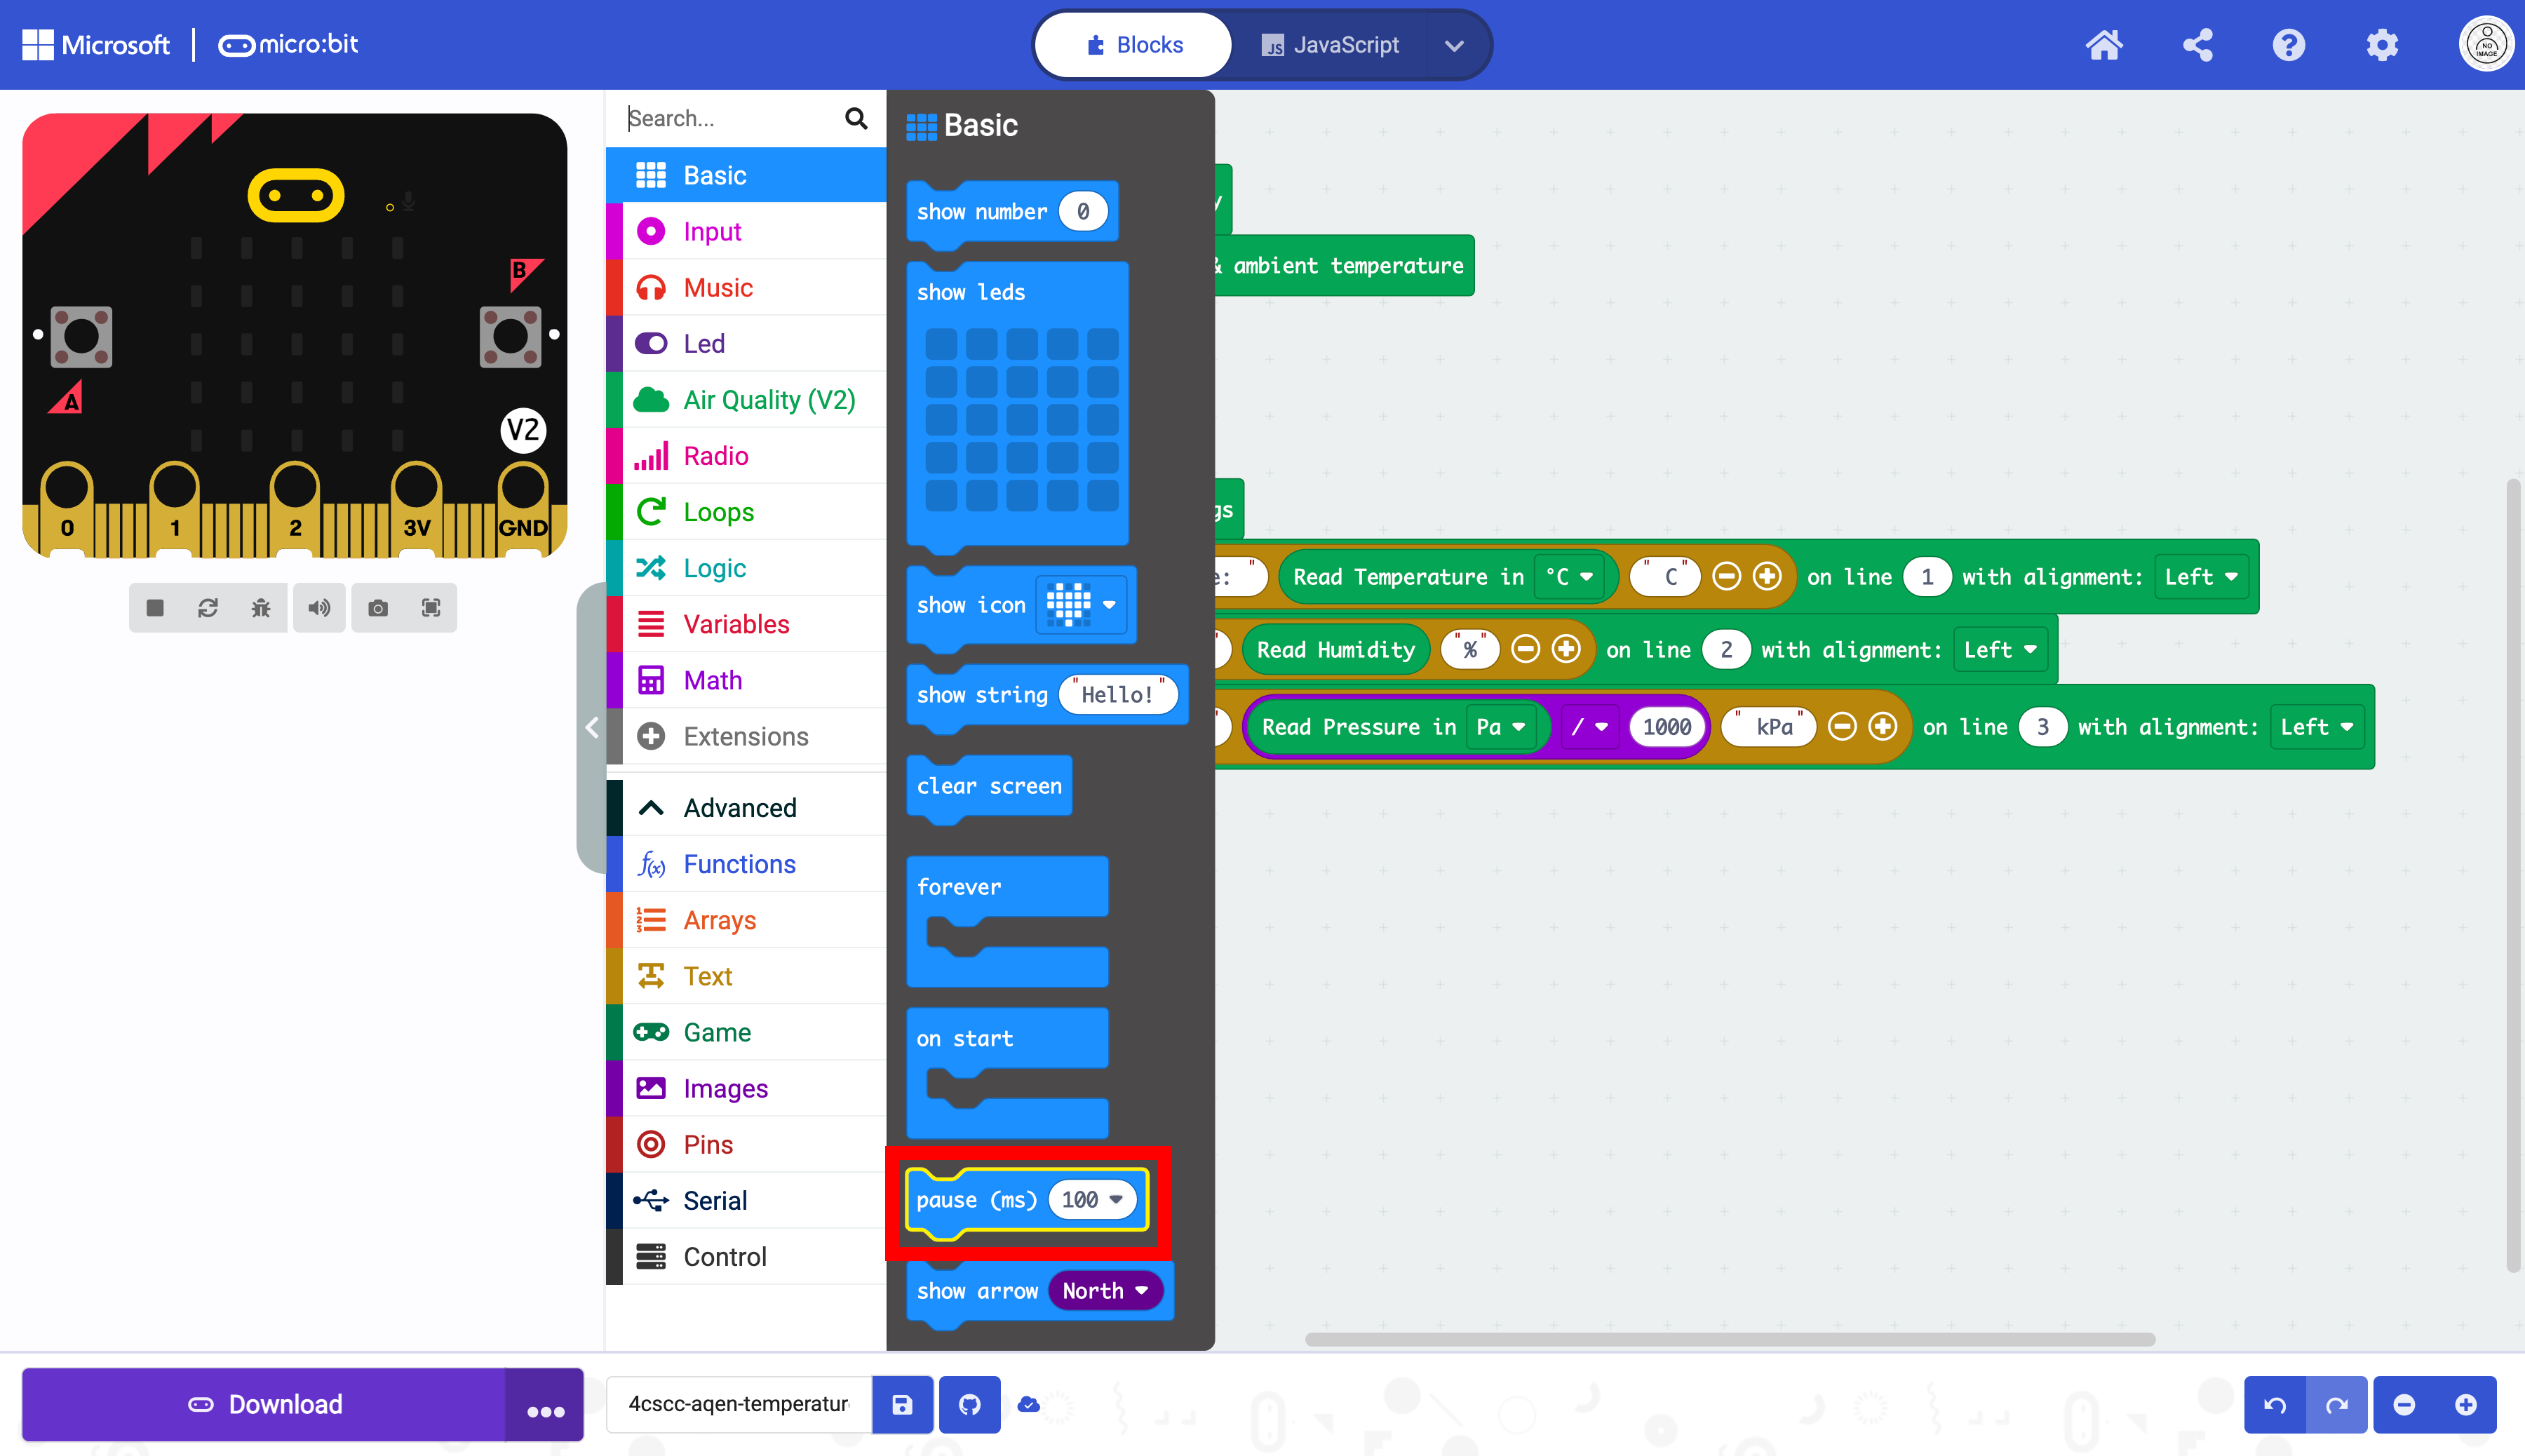
Select the pause block.
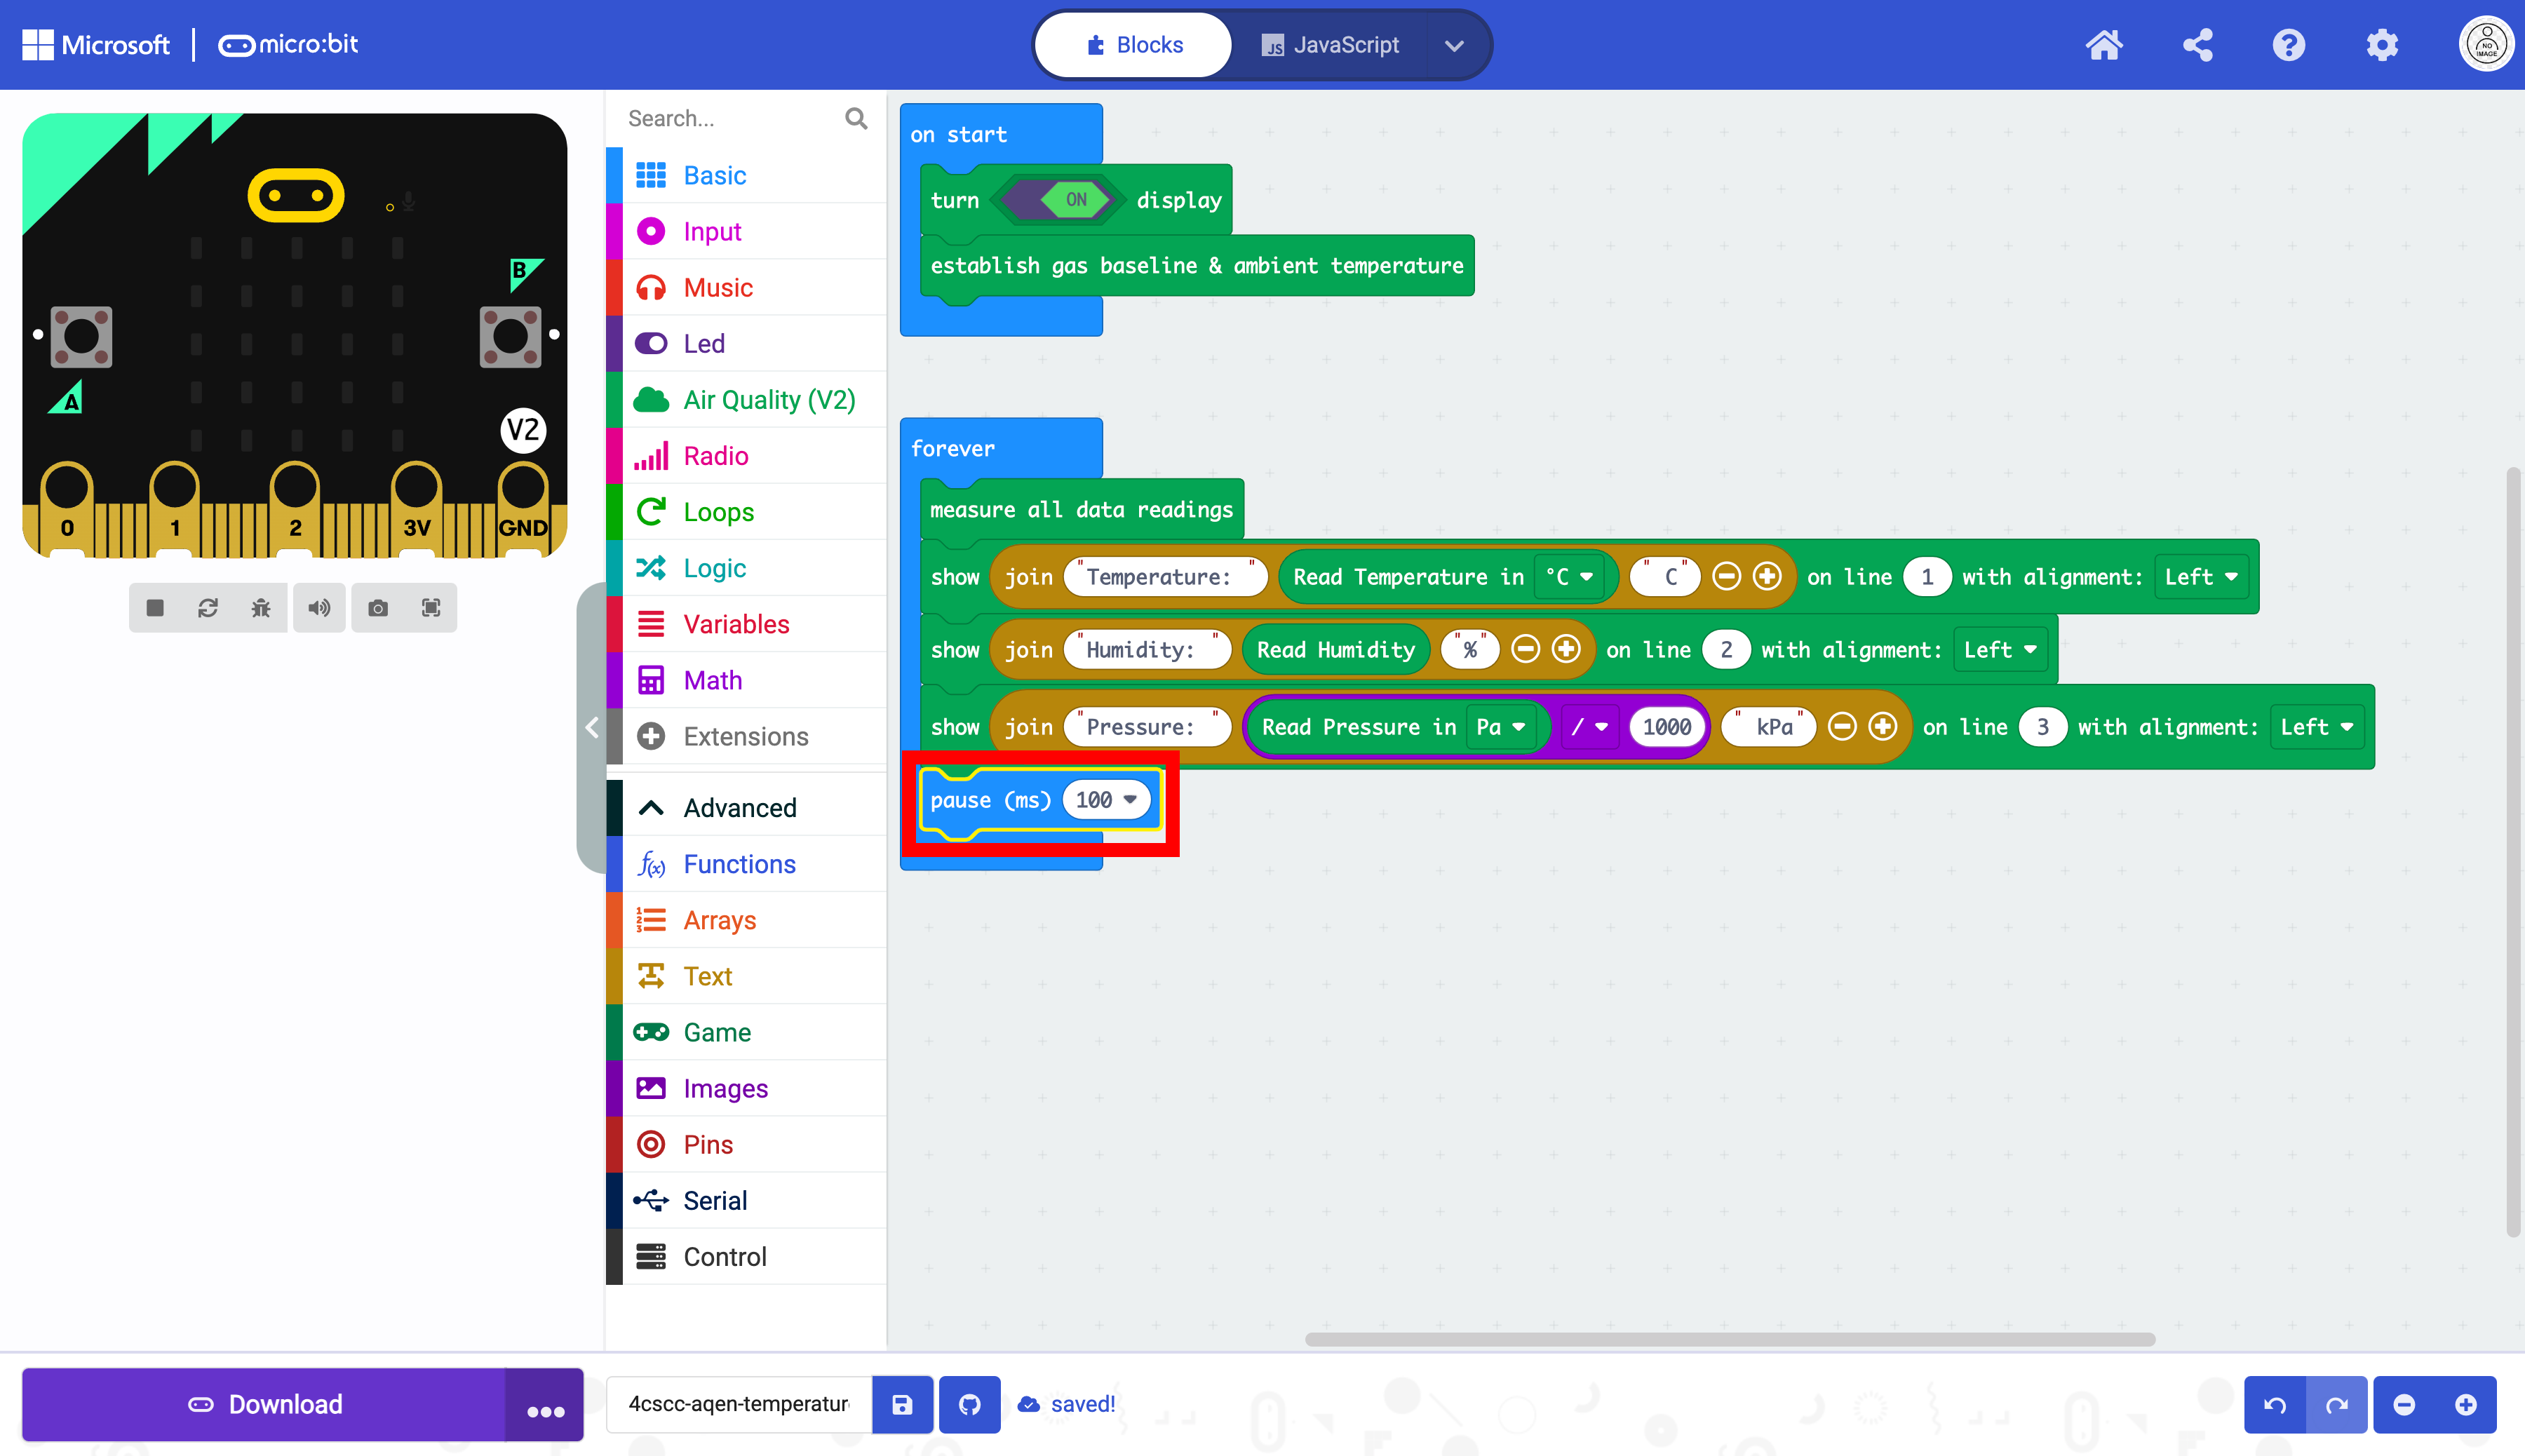
Drag the pause block to the end of the code blocks in the forever block.
Click on the triangle drop down button.
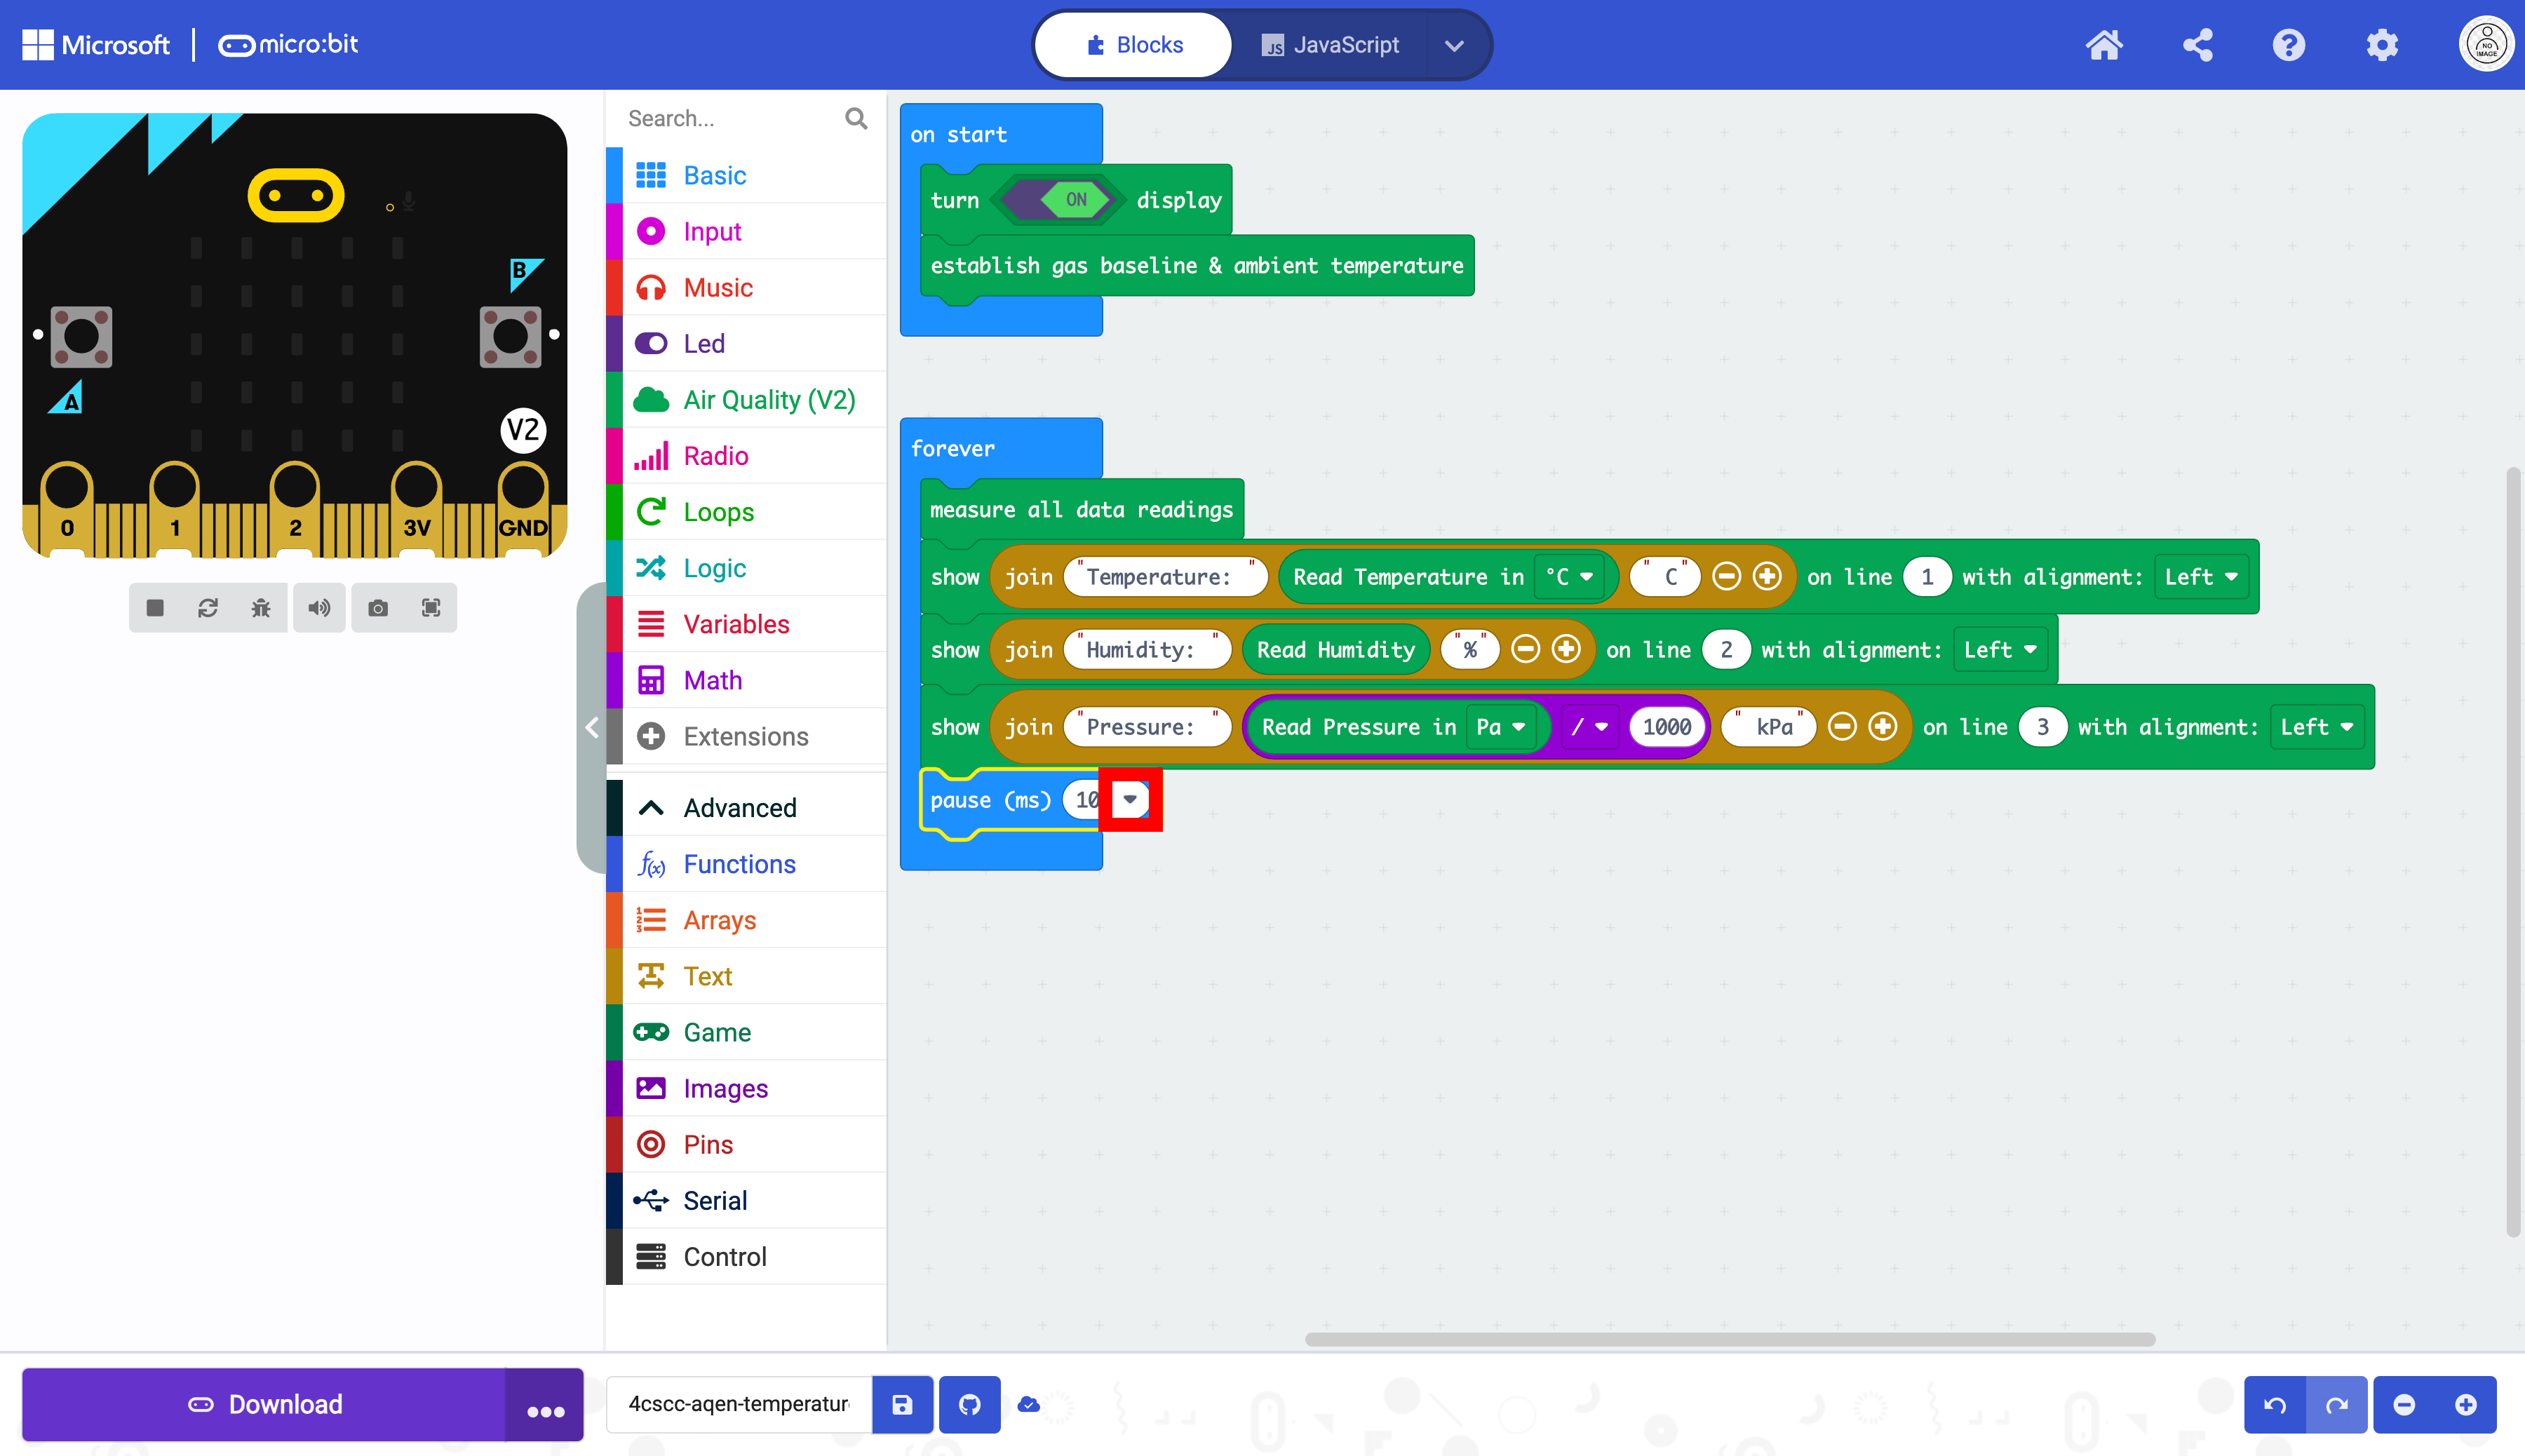
Select 5 seconds.
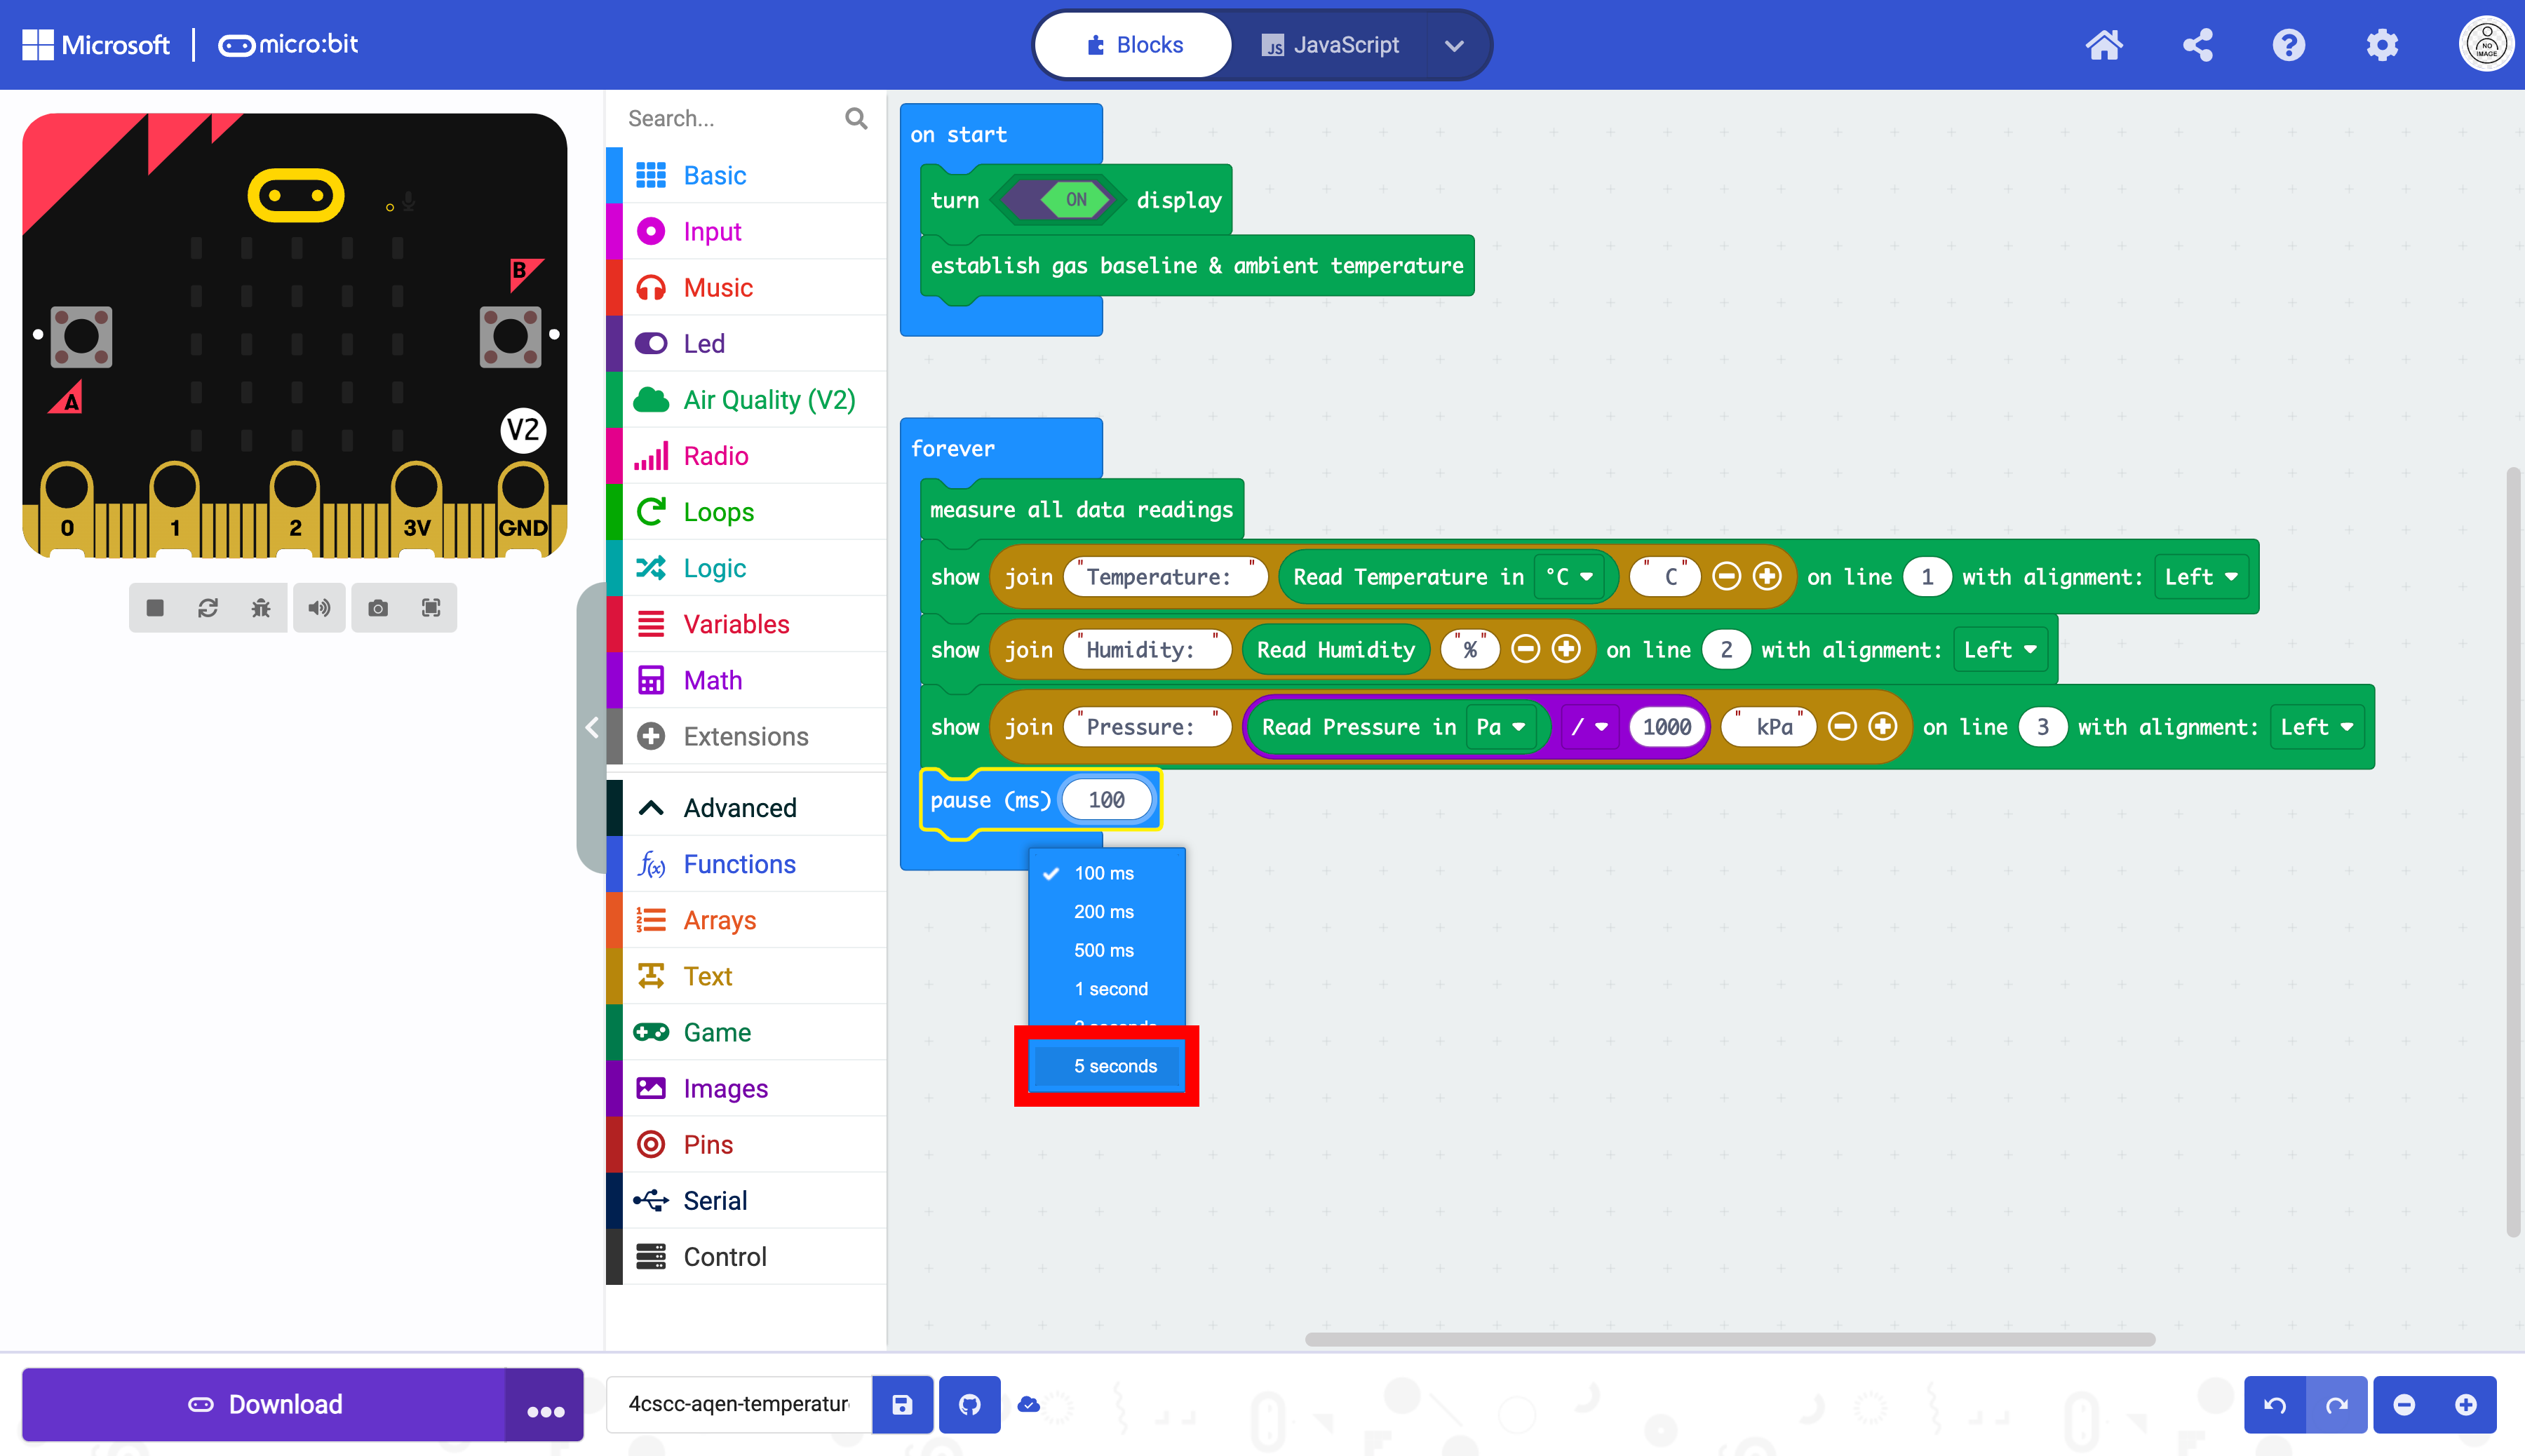
The pause block uses milliseconds (ms) and 5 seconds is 5000 miliseconds.

The micro:bit is now ready to be flashed with code. Press the download button to transfer the code to the micro:bit.